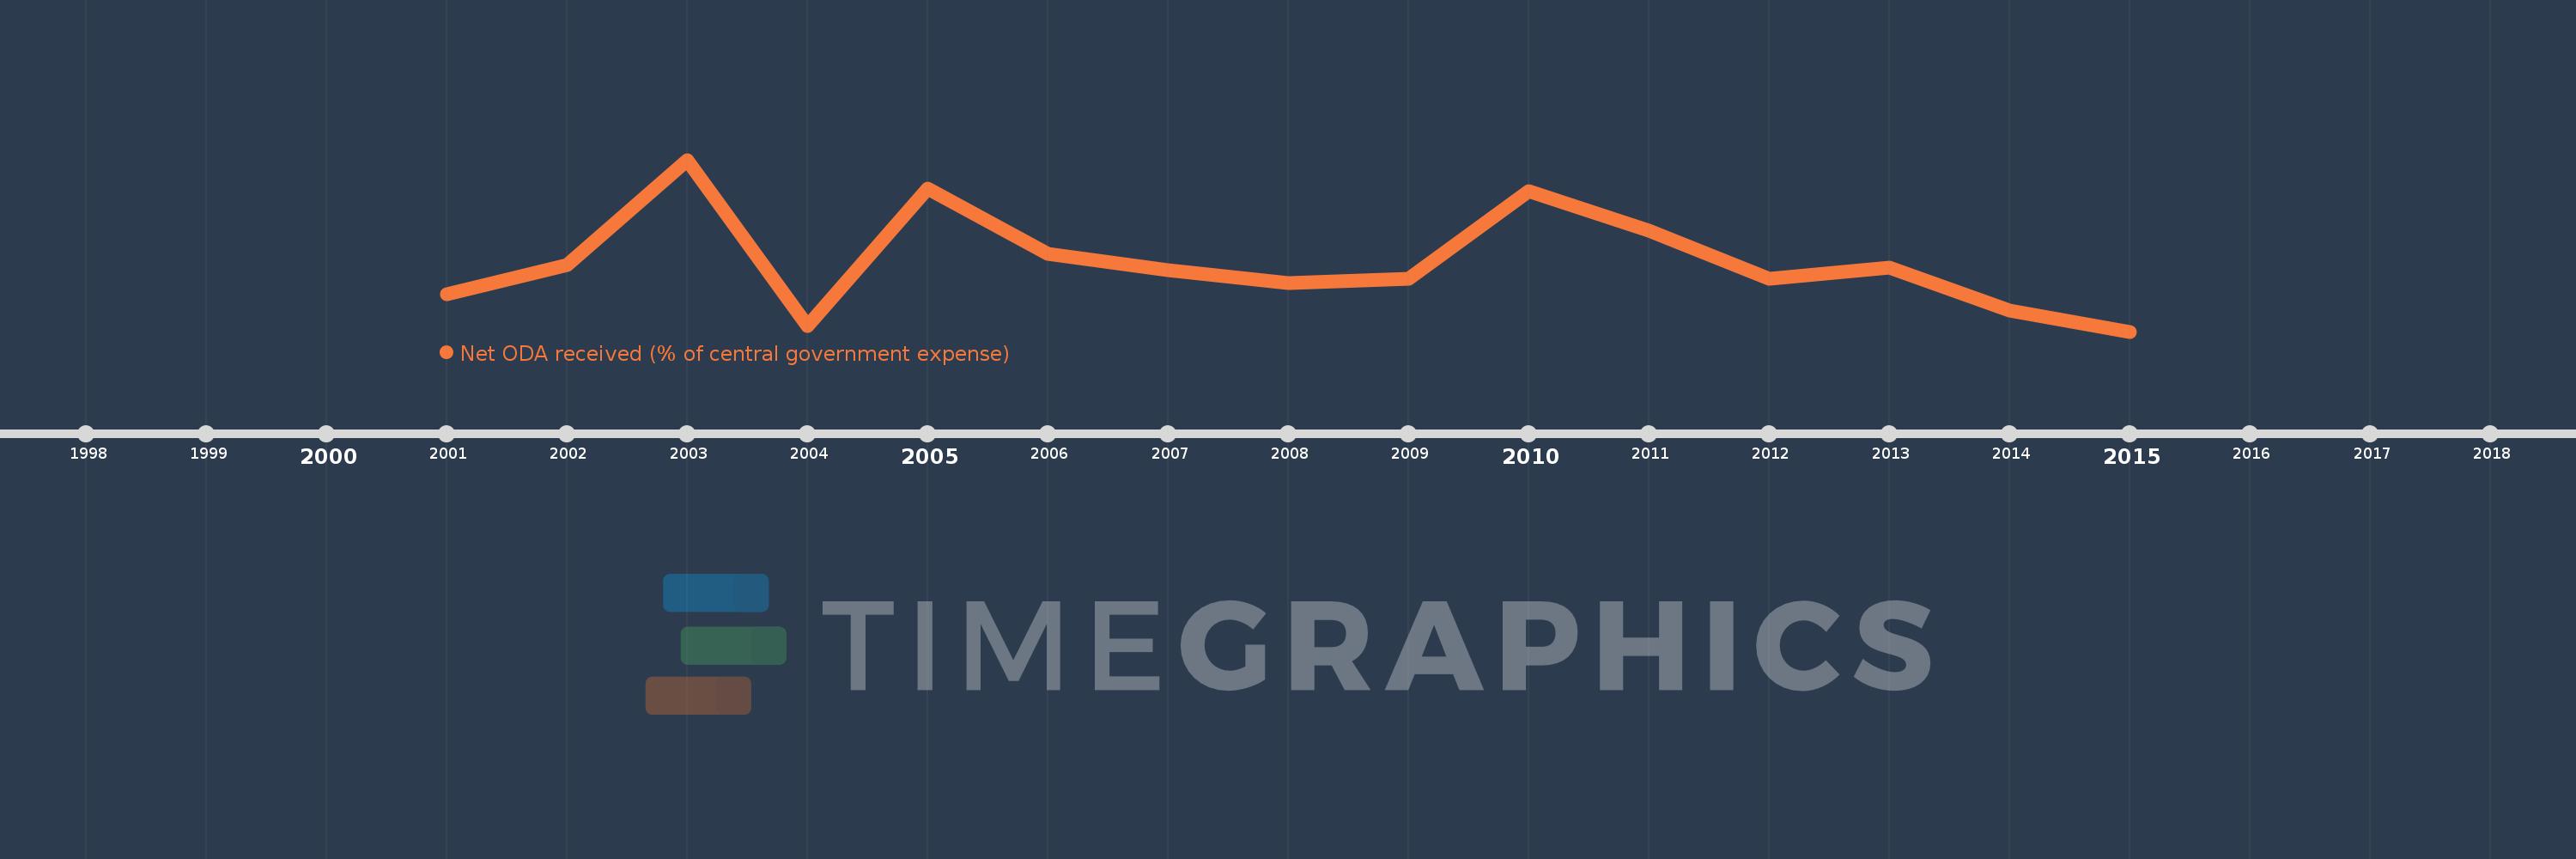
This timeline shows a graph from 2001 to 2015 of Dominica. No data until 2000. Number of actual observations by date: 15.
Source name:
World Development Indicators
Source organization:
Development Assistance Committee of the Organisation for Economic Co-operation and Development, Geographical Distribution of Financial Flows to Developing Countries, Development Co-operation Report, and International Development Statistics database. Data are available online at: www.oecd.org/dac/stats/idsonline. IMF central government expense estimates are used for the denominator.
Categories, topics:
Aid Effectiveness
Last updated:
apr 23, 2017
Indicators value changes by year
Meaning:
22.81
Minimum:
12.114
jan 1, 2015
Maximum:
38.516
jan 1, 2003
At the date of observation
Value
Absolute change
Change from the previous value
jan 1, 2001
17.824
+17.824
0.0%
jan 1, 2002
22.319
+4.495
25.22%
jan 1, 2003
38.516
+16.197
72.57%
jan 1, 2004
13.033
-25.482
-66.16%
jan 1, 2005
34.115
+21.082
161.75%
jan 1, 2006
24.01
-10.105
-29.62%
jan 1, 2007
21.571
-2.439
-10.16%
jan 1, 2008
19.562
-2.009
-9.31%
jan 1, 2009
20.28
+0.718
3.67%
jan 1, 2010
33.651
+13.371
65.93%
jan 1, 2011
27.653
-5.998
-17.82%
jan 1, 2012
20.257
-7.395
-26.74%
jan 1, 2013
21.907
+1.65
8.14%
jan 1, 2014
15.343
-6.564
-29.96%
jan 1, 2015
12.114
-3.23
-21.05%
Ranking of countries by current statistics by years