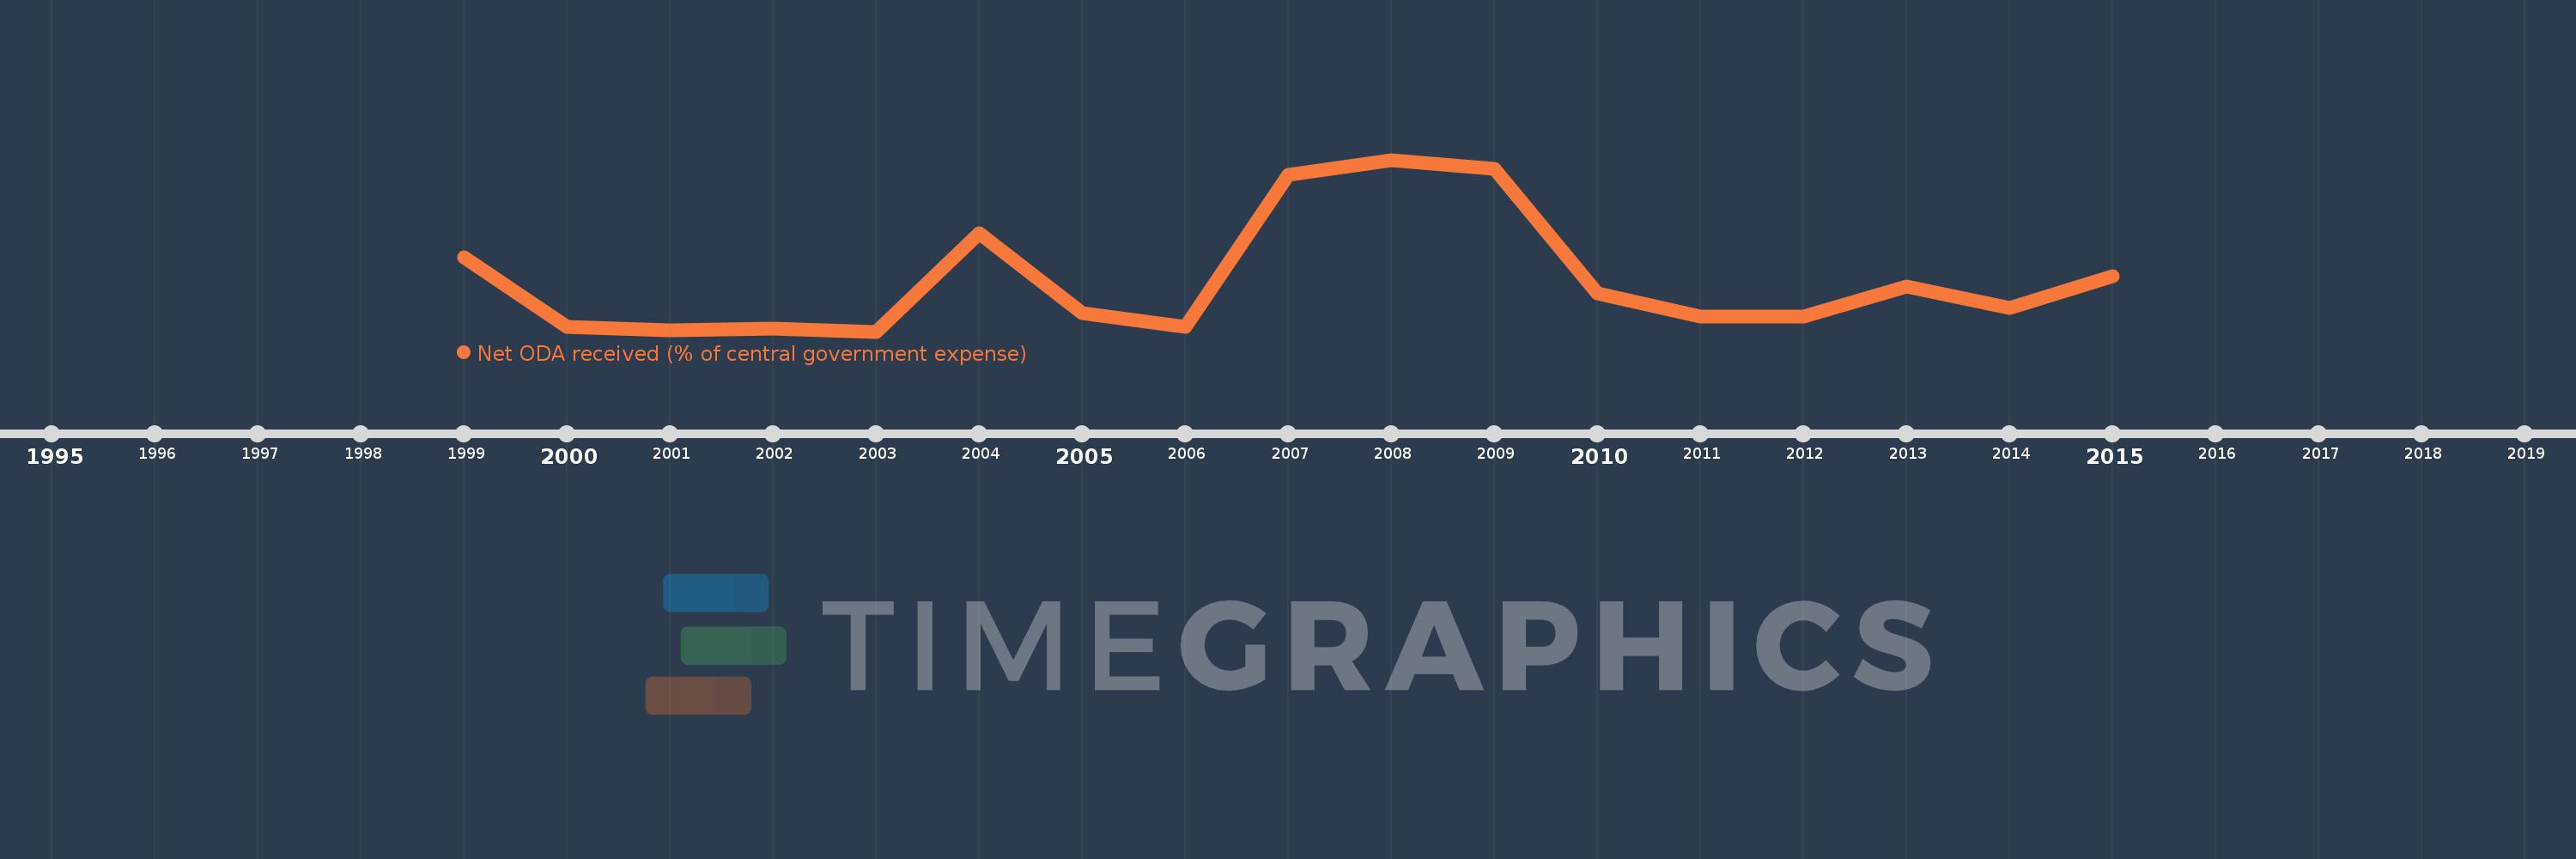
This timeline shows a graph from 1999 to 2015 of Lebanon. No data until 1998. Number of actual observations by date: 17.
Source name:
World Development Indicators
Source organization:
Development Assistance Committee of the Organisation for Economic Co-operation and Development, Geographical Distribution of Financial Flows to Developing Countries, Development Co-operation Report, and International Development Statistics database. Data are available online at: www.oecd.org/dac/stats/idsonline. IMF central government expense estimates are used for the denominator.
Categories, topics:
Aid Effectiveness
Last updated:
apr 23, 2017
Indicators value changes by year
Meaning:
6.403
Minimum:
3.743
jan 1, 2003
Maximum:
12.49
jan 1, 2008
At the date of observation
Value
Absolute change
Change from the previous value
jan 1, 1999
7.534
+7.534
0.0%
jan 1, 2000
3.975
-3.559
-47.24%
jan 1, 2001
3.798
-0.177
-4.46%
jan 1, 2002
3.875
+0.077
2.04%
jan 1, 2003
3.743
-0.132
-3.4%
jan 1, 2004
8.732
+4.989
133.26%
jan 1, 2005
4.678
-4.054
-46.43%
jan 1, 2006
3.994
-0.684
-14.63%
jan 1, 2007
11.727
+7.734
193.63%
jan 1, 2008
12.49
+0.762
6.5%
jan 1, 2009
12.027
-0.463
-3.7%
jan 1, 2010
5.695
-6.332
-52.65%
jan 1, 2011
4.506
-1.189
-20.87%
jan 1, 2012
4.52
+0.014
0.3%
jan 1, 2013
6.032
+1.512
33.46%
jan 1, 2014
4.963
-1.069
-17.72%
jan 1, 2015
6.568
+1.605
32.34%
Ranking of countries by current statistics by years