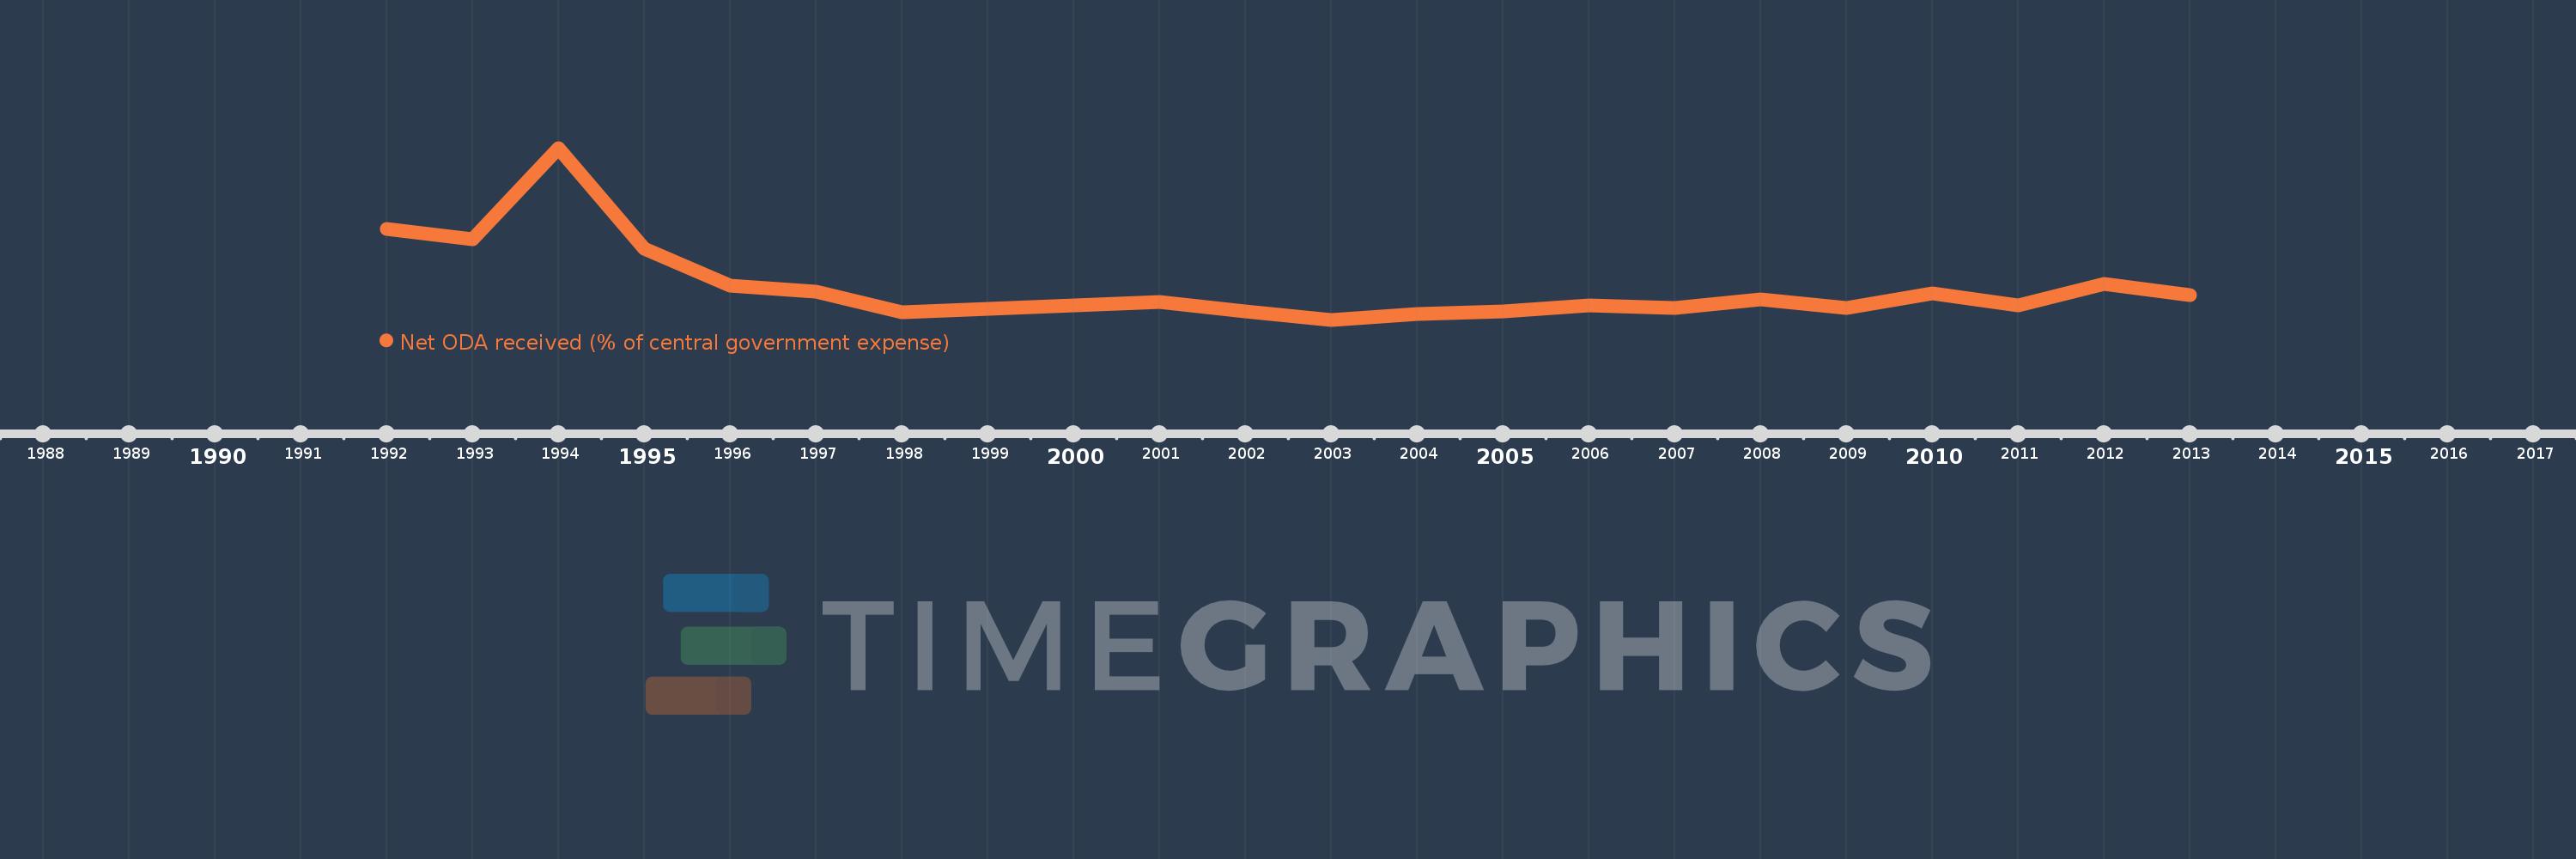
This timeline shows a graph from 1992 to 2013 of Kenya. No data until 1991. Number of actual observations by date: 20.
Source name:
World Development Indicators
Source organization:
Development Assistance Committee of the Organisation for Economic Co-operation and Development, Geographical Distribution of Financial Flows to Developing Countries, Development Co-operation Report, and International Development Statistics database. Data are available online at: www.oecd.org/dac/stats/idsonline. IMF central government expense estimates are used for the denominator.
Categories, topics:
Aid Effectiveness
Last updated:
apr 23, 2017
Indicators value changes by year
Meaning:
31.481
Minimum:
15.737
jan 1, 2003
Maximum:
94.783
jan 1, 1994
At the date of observation
Value
Absolute change
Change from the previous value
jan 1, 1992
57.689
+57.689
0.0%
jan 1, 1993
52.775
-4.914
-8.52%
jan 1, 1994
94.783
+42.008
79.6%
jan 1, 1995
48.353
-46.43
-48.99%
jan 1, 1996
31.296
-17.056
-35.27%
jan 1, 1997
28.654
-2.642
-8.44%
jan 1, 1998
19.306
-9.348
-32.62%
jan 1, 2001
24.059
+4.753
24.62%
jan 1, 2002
19.649
-4.411
-18.33%
jan 1, 2003
15.737
-3.911
-19.91%
jan 1, 2004
18.56
+2.823
17.94%
jan 1, 2005
19.666
+1.106
5.96%
jan 1, 2006
22.277
+2.611
13.28%
jan 1, 2007
21.304
-0.973
-4.37%
jan 1, 2008
25.004
+3.7
17.37%
jan 1, 2009
20.962
-4.042
-16.17%
jan 1, 2010
27.825
+6.863
32.74%
jan 1, 2011
22.511
-5.314
-19.1%
jan 1, 2012
32.297
+9.786
43.47%
jan 1, 2013
26.909
-5.388
-16.68%
Ranking of countries by current statistics by years