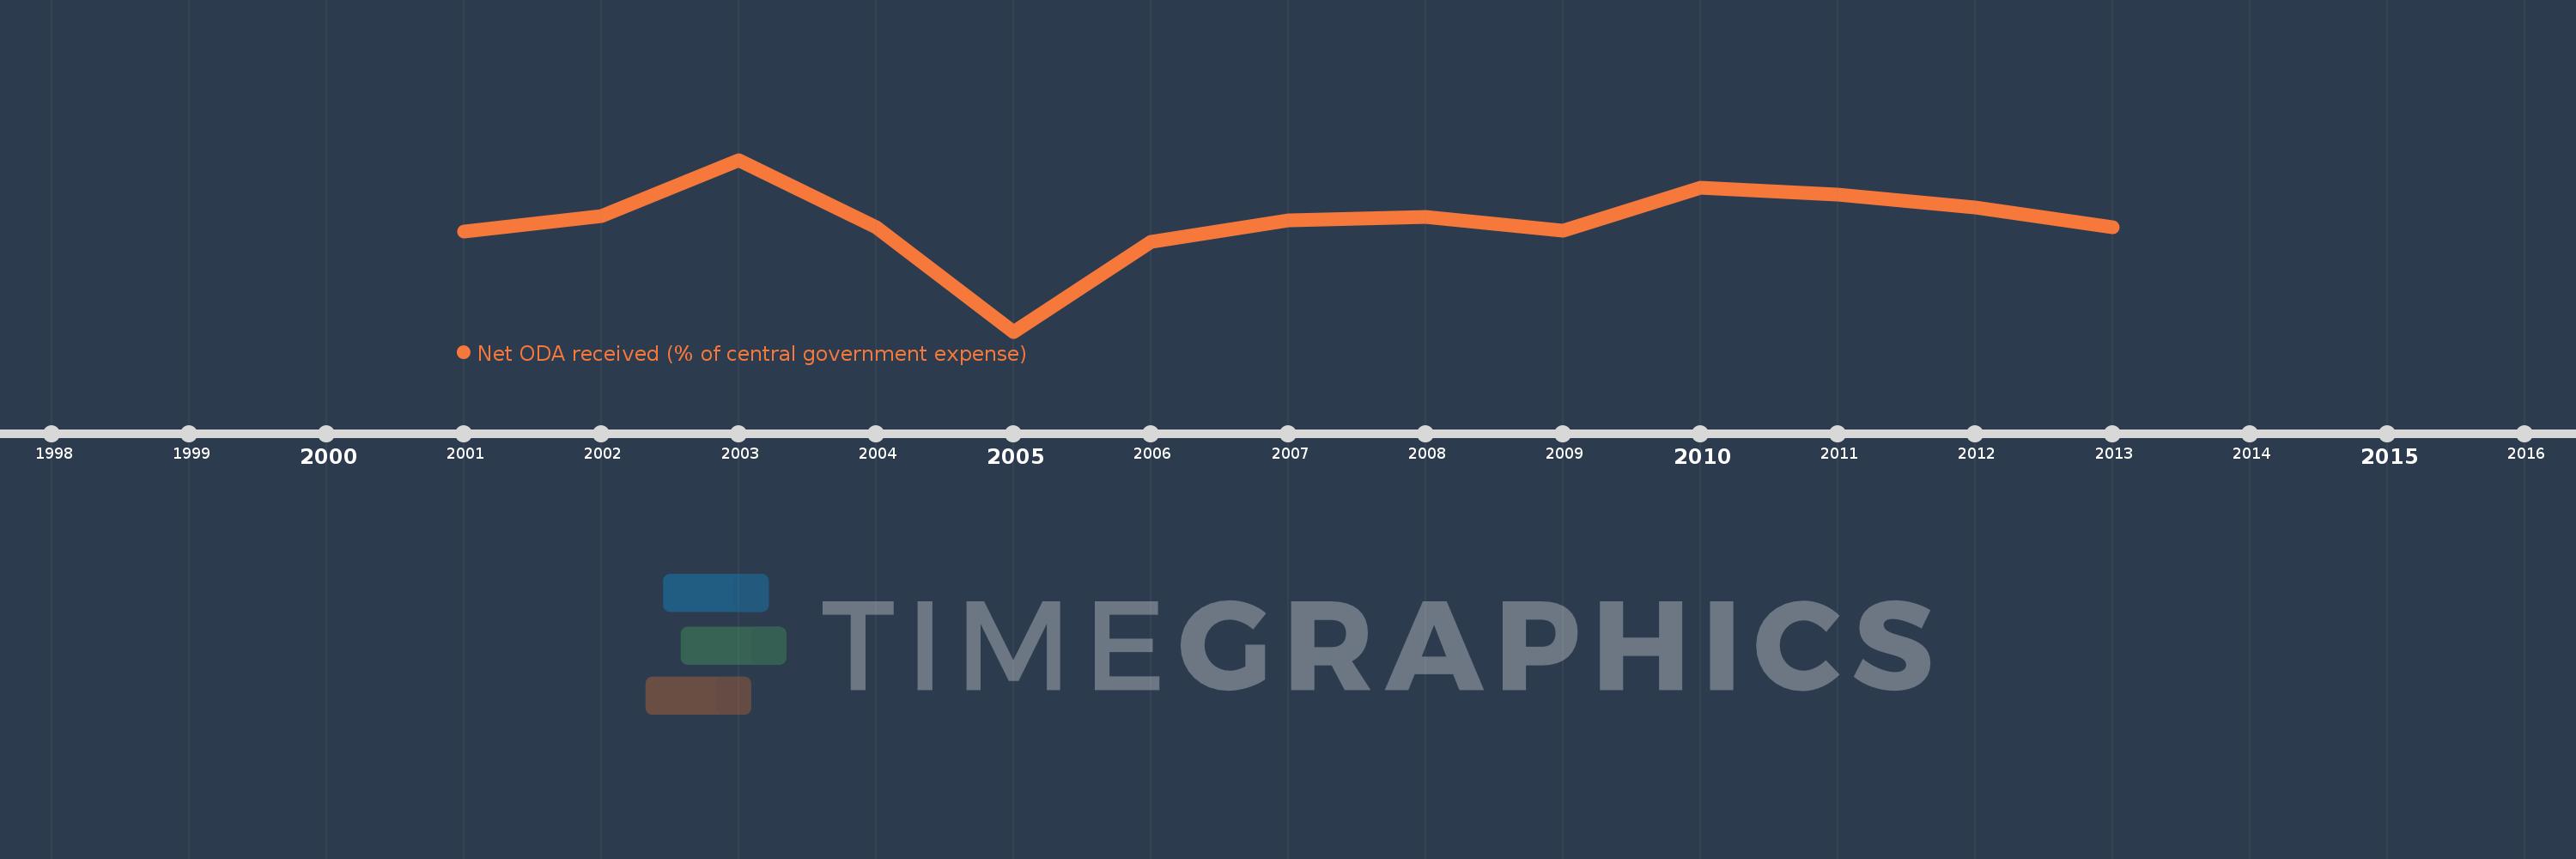
This timeline shows a graph from 2001 to 2013 of St. Lucia. No data until 2000. Number of actual observations by date: 13.
Source name:
World Development Indicators
Source organization:
Development Assistance Committee of the Organisation for Economic Co-operation and Development, Geographical Distribution of Financial Flows to Developing Countries, Development Co-operation Report, and International Development Statistics database. Data are available online at: www.oecd.org/dac/stats/idsonline. IMF central government expense estimates are used for the denominator.
Categories, topics:
Aid Effectiveness
Last updated:
apr 23, 2017
Indicators value changes by year
Meaning:
9.804
Minimum:
-11.738
jan 1, 2005
Maximum:
22.146
jan 1, 2003
At the date of observation
Value
Absolute change
Change from the previous value
jan 1, 2001
8.047
+8.047
0.0%
jan 1, 2002
11.123
+3.076
38.22%
jan 1, 2003
22.146
+11.023
99.1%
jan 1, 2004
8.929
-13.217
-59.68%
jan 1, 2005
-11.738
-20.667
-231.47%
jan 1, 2006
5.898
+17.636
-150.25%
jan 1, 2007
10.275
+4.377
74.21%
jan 1, 2008
10.881
+0.605
5.89%
jan 1, 2009
8.215
-2.665
-24.5%
jan 1, 2010
16.715
+8.5
103.46%
jan 1, 2011
15.363
-1.352
-8.09%
jan 1, 2012
12.822
-2.541
-16.54%
jan 1, 2013
8.774
-4.048
-31.57%
Ranking of countries by current statistics by years