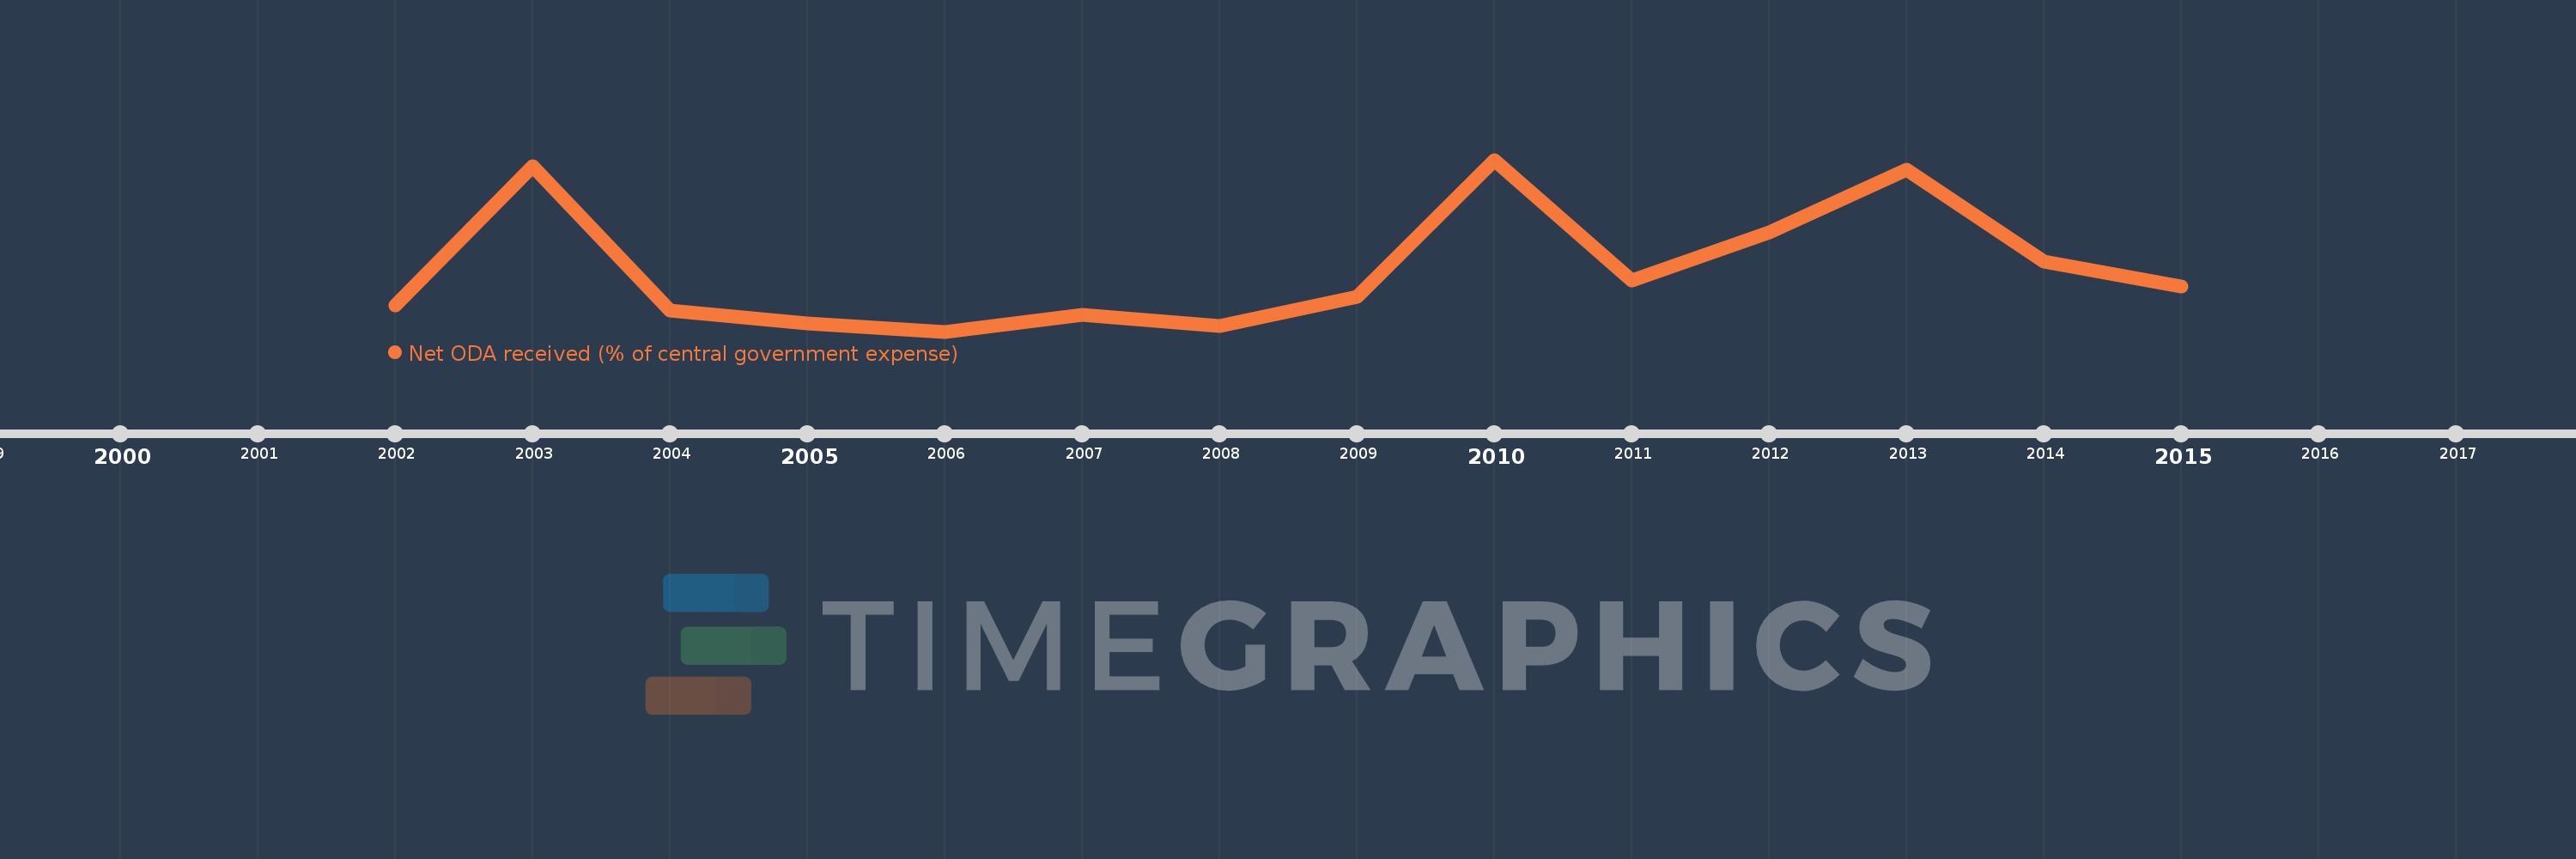
This timeline shows a graph from 2002 to 2015 of Cote d'Ivoire. No data until 2001. Number of actual observations by date: 14.
Source name:
World Development Indicators
Source organization:
Development Assistance Committee of the Organisation for Economic Co-operation and Development, Geographical Distribution of Financial Flows to Developing Countries, Development Co-operation Report, and International Development Statistics database. Data are available online at: www.oecd.org/dac/stats/idsonline. IMF central government expense estimates are used for the denominator.
Categories, topics:
Aid Effectiveness
Last updated:
apr 23, 2017
Indicators value changes by year
Meaning:
27.077
Minimum:
3.606
jan 1, 2006
Maximum:
67.906
jan 1, 2010
At the date of observation
Value
Absolute change
Change from the previous value
jan 1, 2002
13.345
+13.345
0.0%
jan 1, 2003
65.42
+52.074
390.21%
jan 1, 2004
11.593
-53.826
-82.28%
jan 1, 2005
6.767
-4.826
-41.63%
jan 1, 2006
3.606
-3.162
-46.72%
jan 1, 2007
10.032
+6.427
178.24%
jan 1, 2008
5.587
-4.446
-44.31%
jan 1, 2009
16.728
+11.141
199.42%
jan 1, 2010
67.906
+51.178
305.94%
jan 1, 2011
22.776
-45.13
-66.46%
jan 1, 2012
40.759
+17.984
78.96%
jan 1, 2013
64.116
+23.357
57.3%
jan 1, 2014
29.958
-34.159
-53.28%
jan 1, 2015
20.487
-9.47
-31.61%
Ranking of countries by current statistics by years