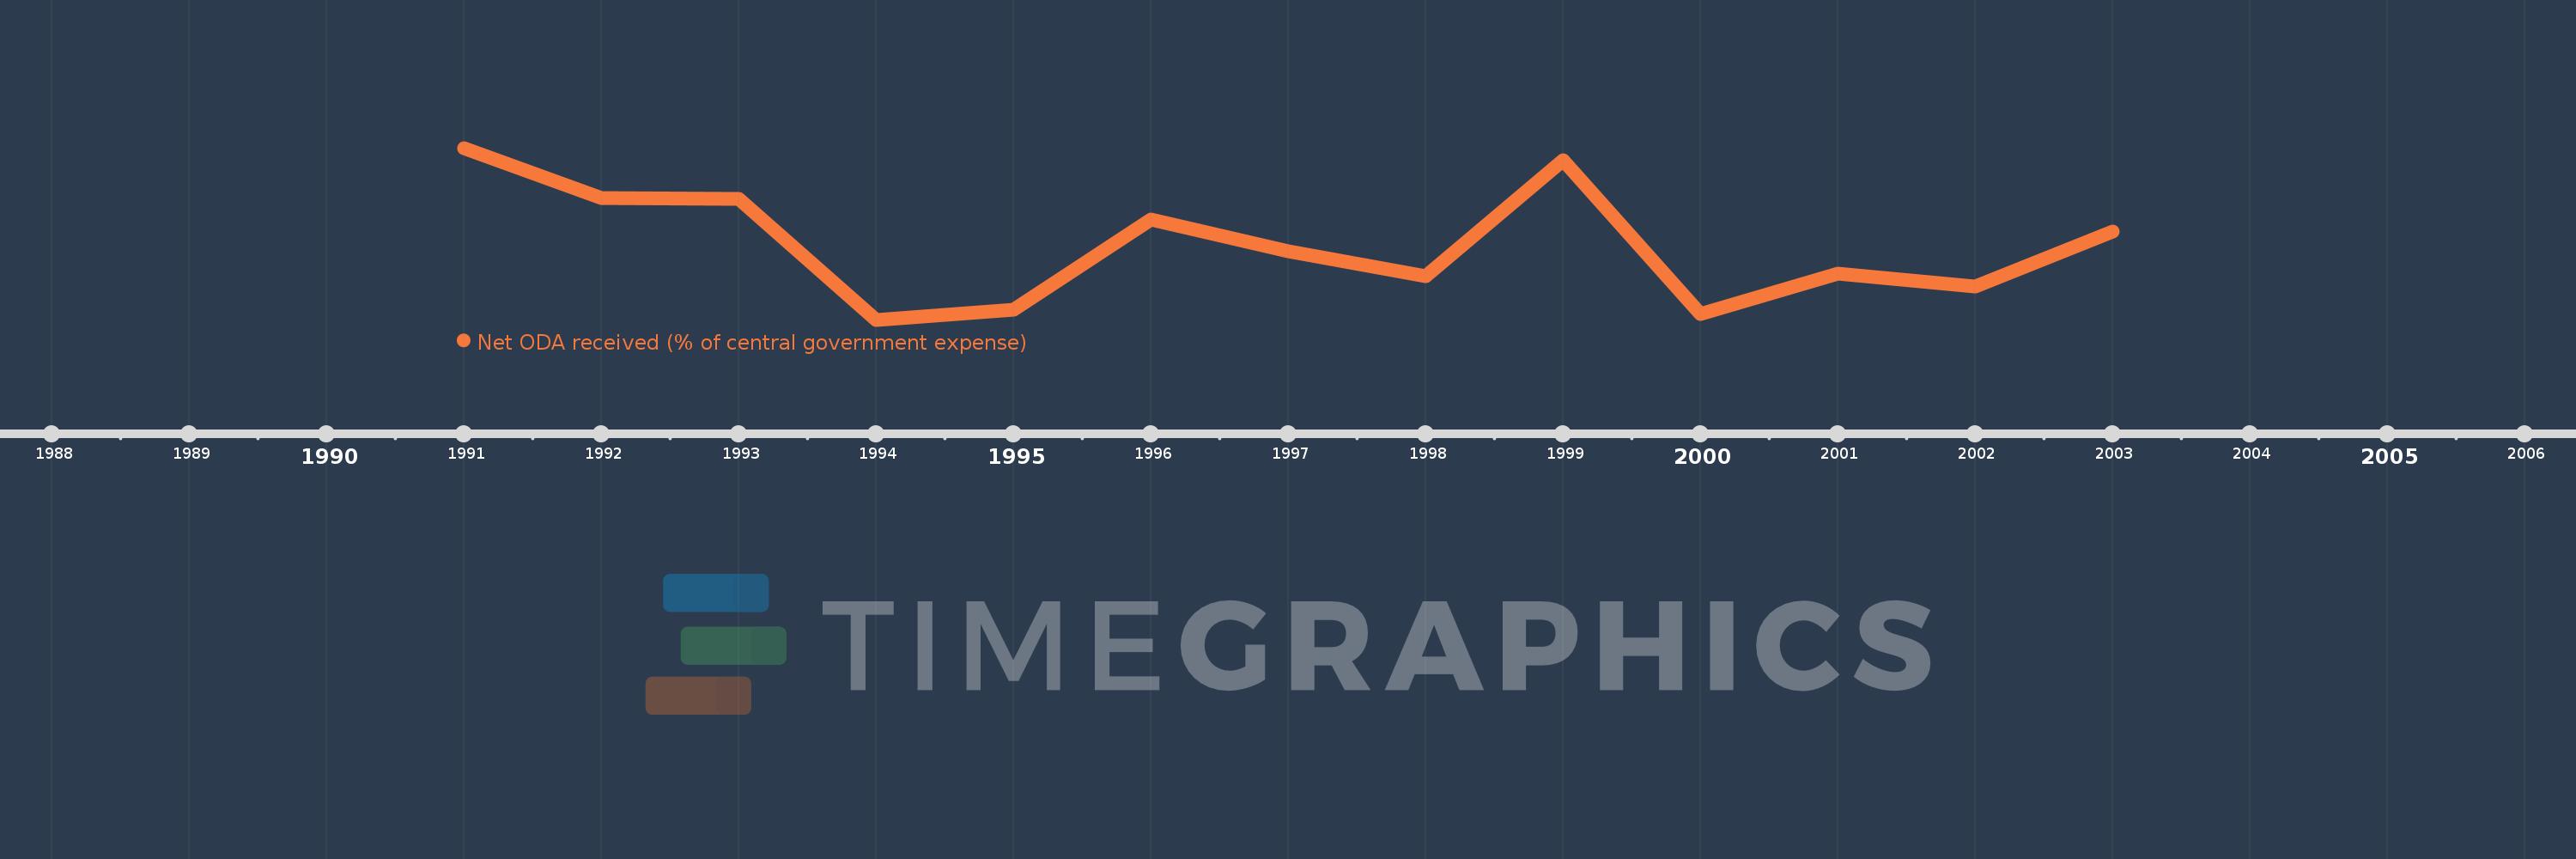
This timeline shows a graph from 1991 to 2003 of Papua New Guinea. No data until 1990. Number of actual observations by date: 13.
Source name:
World Development Indicators
Source organization:
Development Assistance Committee of the Organisation for Economic Co-operation and Development, Geographical Distribution of Financial Flows to Developing Countries, Development Co-operation Report, and International Development Statistics database. Data are available online at: www.oecd.org/dac/stats/idsonline. IMF central government expense estimates are used for the denominator.
Categories, topics:
Aid Effectiveness
Last updated:
apr 23, 2017
Indicators value changes by year
Meaning:
29.438
Minimum:
20.515
jan 1, 1994
Maximum:
41.117
jan 1, 1991
At the date of observation
Value
Absolute change
Change from the previous value
jan 1, 1991
41.117
+41.117
0.0%
jan 1, 1992
35.061
-6.055
-14.73%
jan 1, 1993
35.0
-0.061
-0.17%
jan 1, 1994
20.515
-14.486
-41.39%
jan 1, 1995
21.724
+1.209
5.89%
jan 1, 1996
32.546
+10.823
49.82%
jan 1, 1997
28.684
-3.862
-11.87%
jan 1, 1998
25.719
-2.966
-10.34%
jan 1, 1999
39.623
+13.904
54.06%
jan 1, 2000
21.176
-18.446
-46.55%
jan 1, 2001
26.005
+4.829
22.8%
jan 1, 2002
24.454
-1.551
-5.96%
jan 1, 2003
31.065
+6.61
27.03%
Ranking of countries by current statistics by years