Download This statistics in other country:
AfghanistanAlbaniaAlgeriaAngolaAntigua and BarbudaArmeniaAzerbaijanBahamas, TheBahrainBangladeshBarbadosBelarusBelizeBeninBhutanBoliviaBosnia and HerzegovinaBotswanaBrazilBurkina FasoBurundiCabo VerdeCambodiaCentral African RepublicChileColombiaCongo, Dem. Rep.Congo, Rep.Costa RicaCote d'IvoireCroatiaCyprusDominicaDominican RepublicEgypt, Arab Rep.El SalvadorEquatorial GuineaEthiopiaFijiGambia, TheGeorgiaGhanaGrenadaGuatemalaHondurasIndiaIndonesiaIran, Islamic Rep.IraqIsraelJamaicaJordanKazakhstanKenyaKiribatiKorea, Rep.KuwaitKyrgyz RepublicLao PDRLebanonLesothoLiberiaMacao SAR, ChinaMacedonia, FYRMadagascarMalawiMalaysiaMaldivesMaliMaltaMauritiusMexicoMicronesia, Fed. Sts.MoldovaMongoliaMoroccoMozambiqueMyanmarNamibiaNepalNicaraguaNigeriaOmanPakistanPanamaPapua New GuineaParaguayPeruPhilippinesRwandaSamoaSao Tome and PrincipeSenegalSerbiaSeychellesSierra LeoneSingaporeSloveniaSolomon IslandsSouth AfricaSri LankaSt. Kitts and NevisSt. LuciaSurinameSwazilandSyrian Arab RepublicTajikistanTanzaniaThailandTimor-LesteTogoTrinidad and TobagoTunisiaTurkeyUgandaUkraineUruguayVanuatuVenezuela, RBVietnamWest Bank and GazaYemen, Rep.ZambiaZimbabwe Timeline:
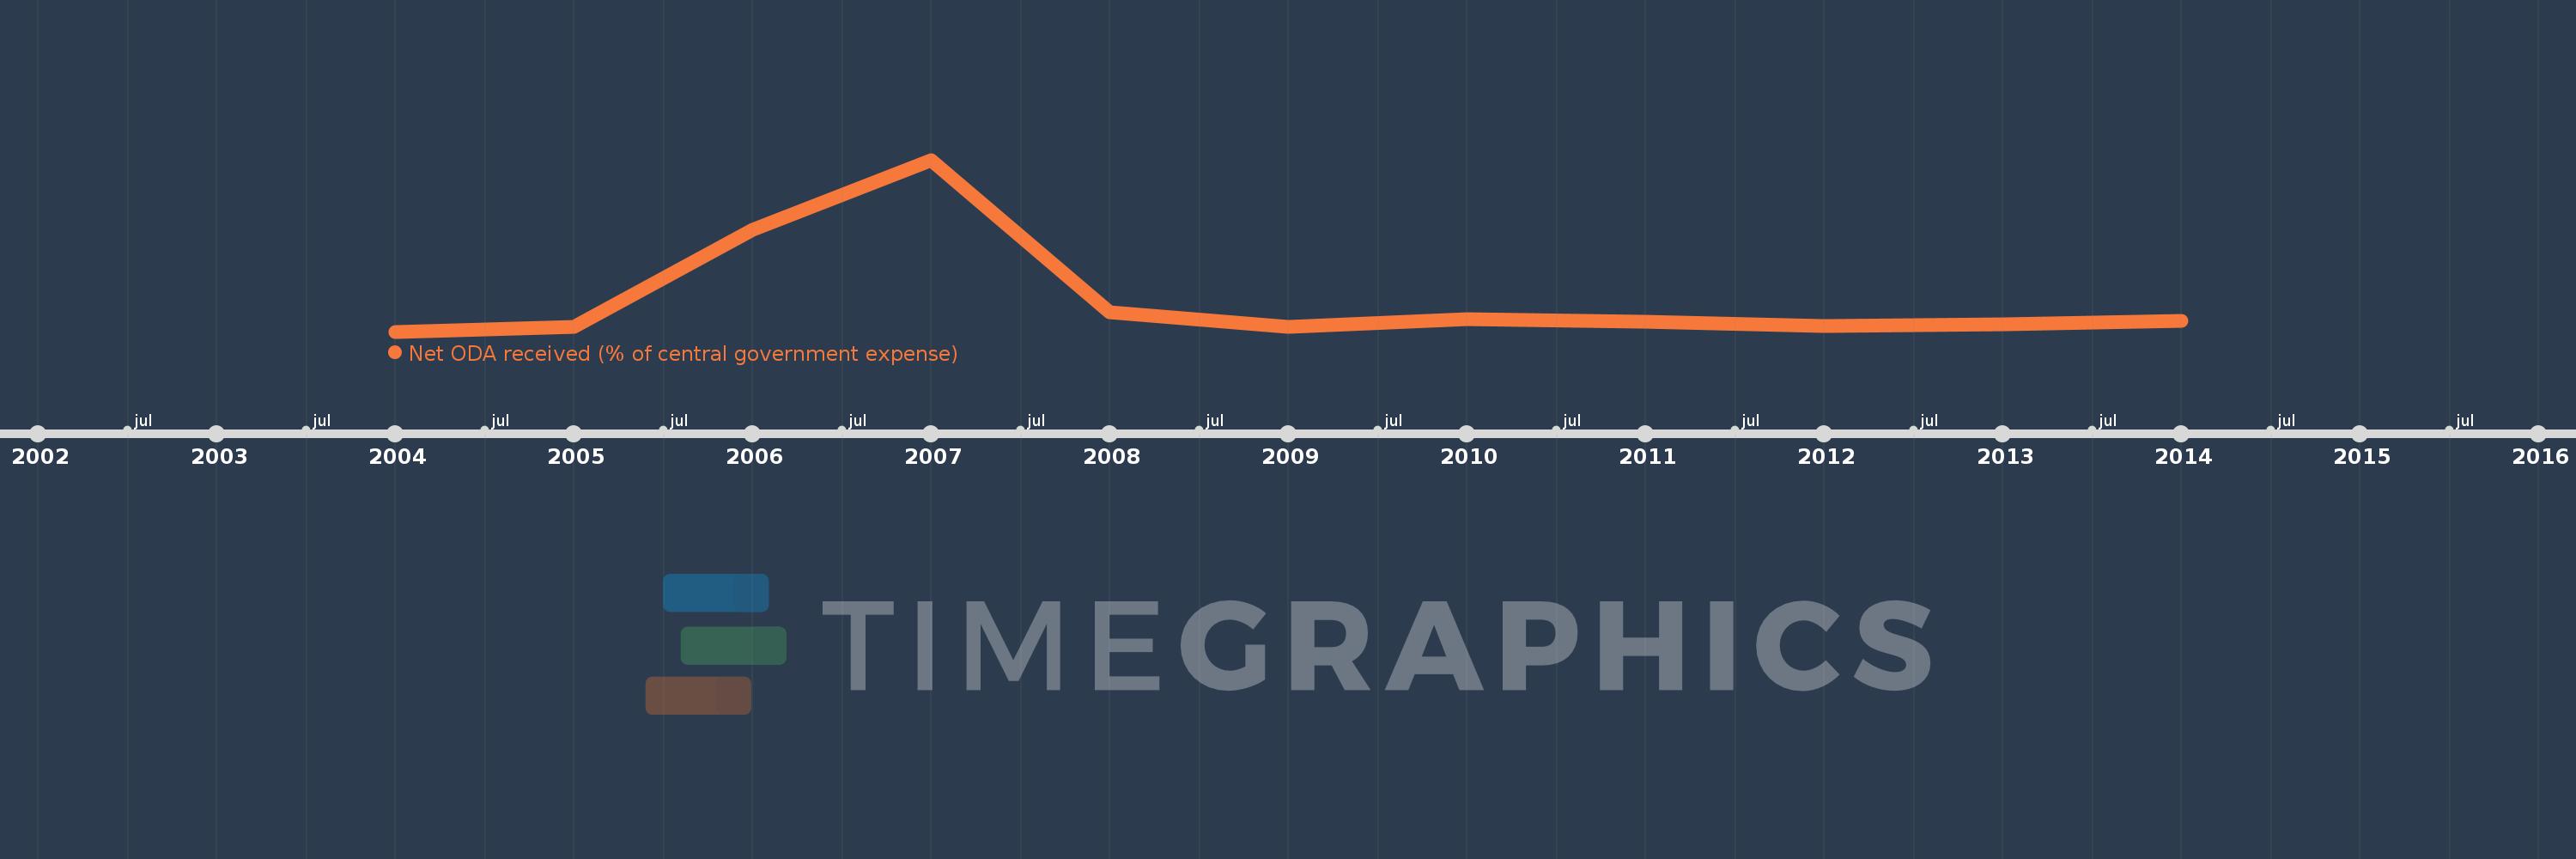
This timeline shows a graph from 2004 to 2014 of Nigeria. No data until 2003. Number of actual observations by date: 11.
Source name:
World Development Indicators
Source organization:
Development Assistance Committee of the Organisation for Economic Co-operation and Development, Geographical Distribution of Financial Flows to Developing Countries, Development Co-operation Report, and International Development Statistics database. Data are available online at: www.oecd.org/dac/stats/idsonline. IMF central government expense estimates are used for the denominator.
Categories, topics:
Aid Effectiveness
Last updated:
apr 23, 2017
Indicators value changes by year
Maximum:
98.966
jan 1, 2007
At the date of observation
Value
Absolute change
Change from the previous value
jan 1, 2004
3.979
+3.979
0.0%
jan 1, 2005
6.649
+2.67
67.1%
jan 1, 2006
60.081
+53.431
803.54%
jan 1, 2007
98.966
+38.885
64.72%
jan 1, 2008
14.549
-84.417
-85.3%
jan 1, 2009
6.708
-7.841
-53.89%
jan 1, 2010
10.727
+4.019
59.92%
jan 1, 2011
9.342
-1.386
-12.92%
jan 1, 2012
7.198
-2.144
-22.95%
jan 1, 2013
8.071
+0.873
12.13%
jan 1, 2014
9.705
+1.634
20.25%
Ranking of countries by current statistics by years