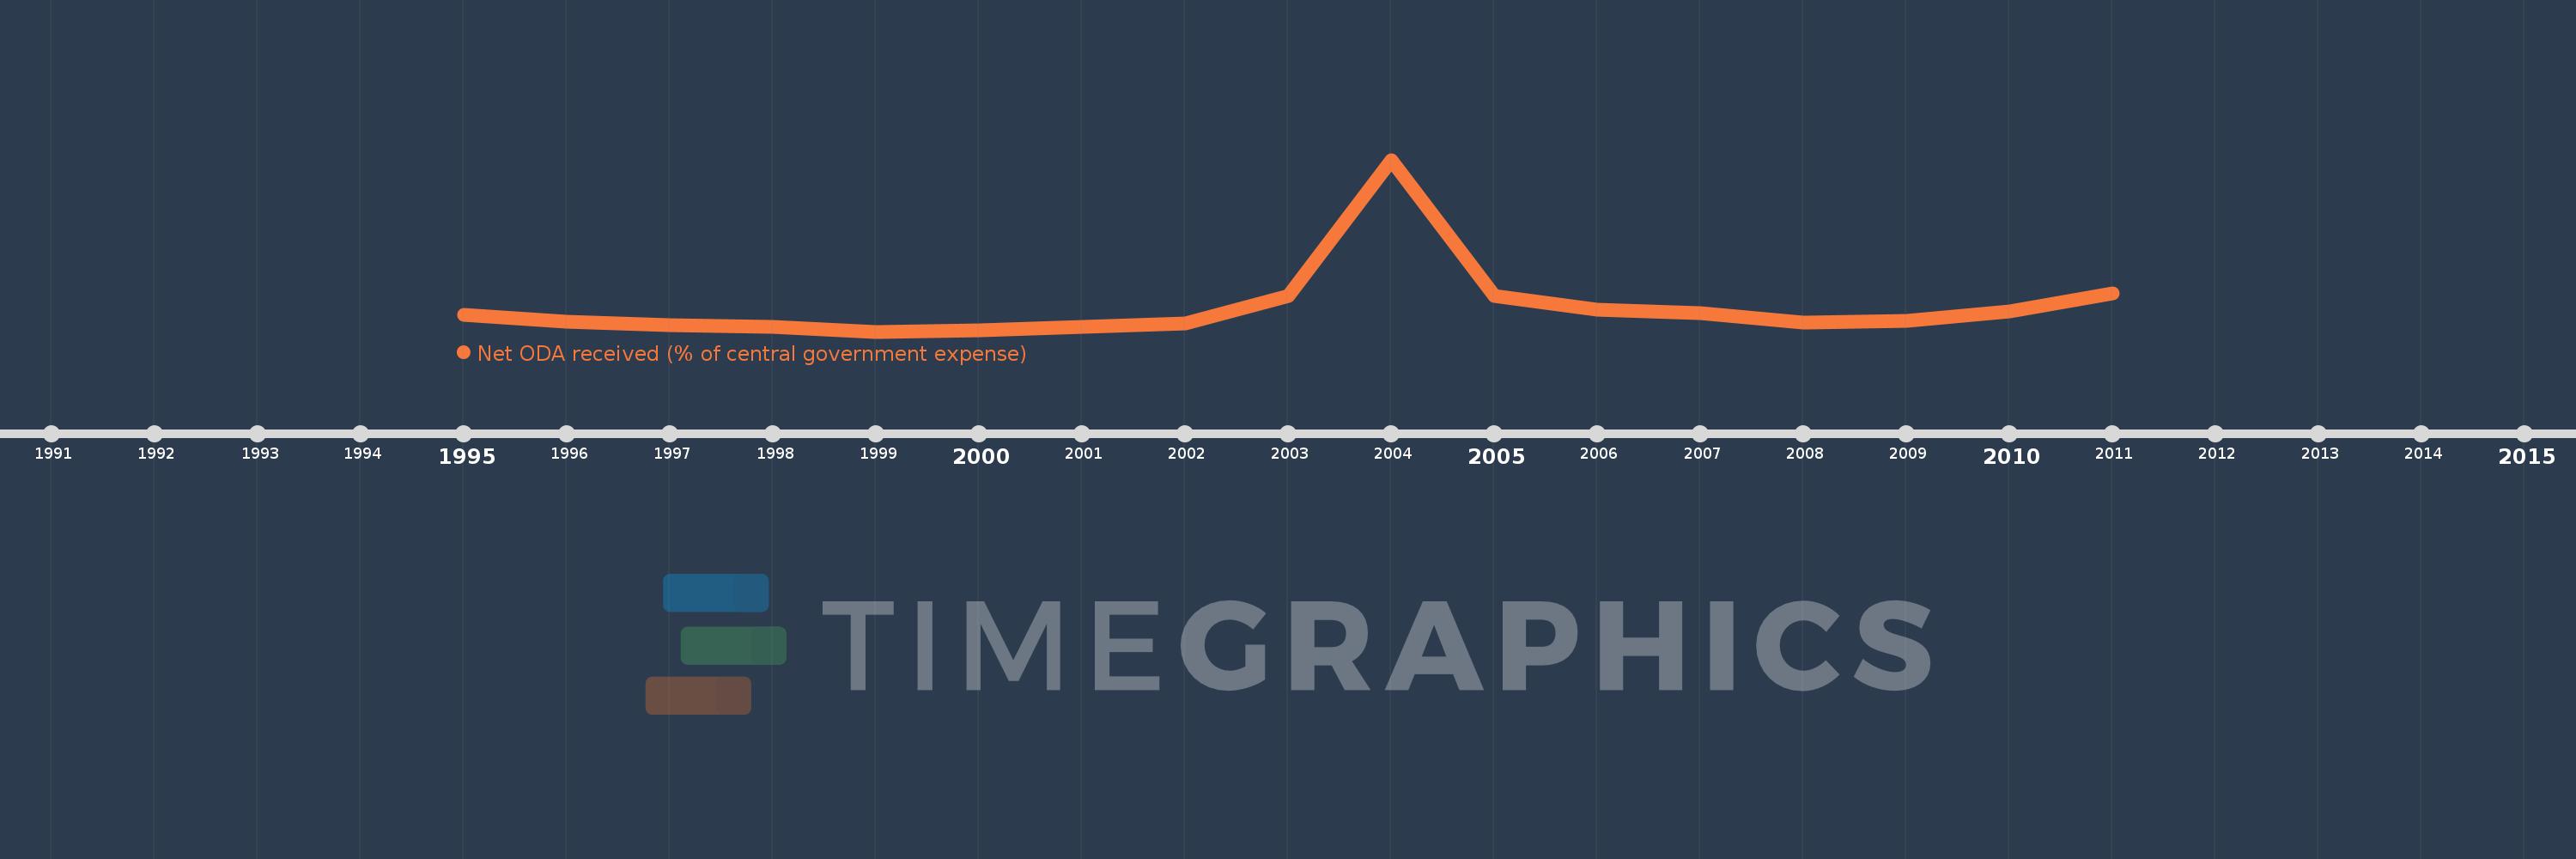
This timeline shows a graph from 1995 to 2011 of Congo, Dem. Rep.. No data until 1994. Number of actual observations by date: 17.
Source name:
World Development Indicators
Source organization:
Development Assistance Committee of the Organisation for Economic Co-operation and Development, Geographical Distribution of Financial Flows to Developing Countries, Development Co-operation Report, and International Development Statistics database. Data are available online at: www.oecd.org/dac/stats/idsonline. IMF central government expense estimates are used for the denominator.
Categories, topics:
Aid Effectiveness
Last updated:
apr 23, 2017
Indicators value changes by year
Meaning:
131.218
Minimum:
22.734
jan 1, 1999
Maximum:
787.247
jan 1, 2004
At the date of observation
Value
Absolute change
Change from the previous value
jan 1, 1995
96.809
+96.809
0.0%
jan 1, 1996
65.823
-30.986
-32.01%
jan 1, 1997
51.514
-14.31
-21.74%
jan 1, 1998
45.629
-5.885
-11.42%
jan 1, 1999
22.734
-22.895
-50.18%
jan 1, 2000
29.868
+7.134
31.38%
jan 1, 2001
45.358
+15.49
51.86%
jan 1, 2002
58.394
+13.037
28.74%
jan 1, 2003
179.932
+121.538
208.13%
jan 1, 2004
787.247
+607.315
337.52%
jan 1, 2005
181.582
-605.665
-76.93%
jan 1, 2006
119.906
-61.676
-33.97%
jan 1, 2007
105.379
-14.527
-12.12%
jan 1, 2008
63.642
-41.737
-39.61%
jan 1, 2009
72.249
+8.607
13.52%
jan 1, 2010
111.792
+39.543
54.73%
jan 1, 2011
192.841
+81.049
72.5%
Ranking of countries by current statistics by years