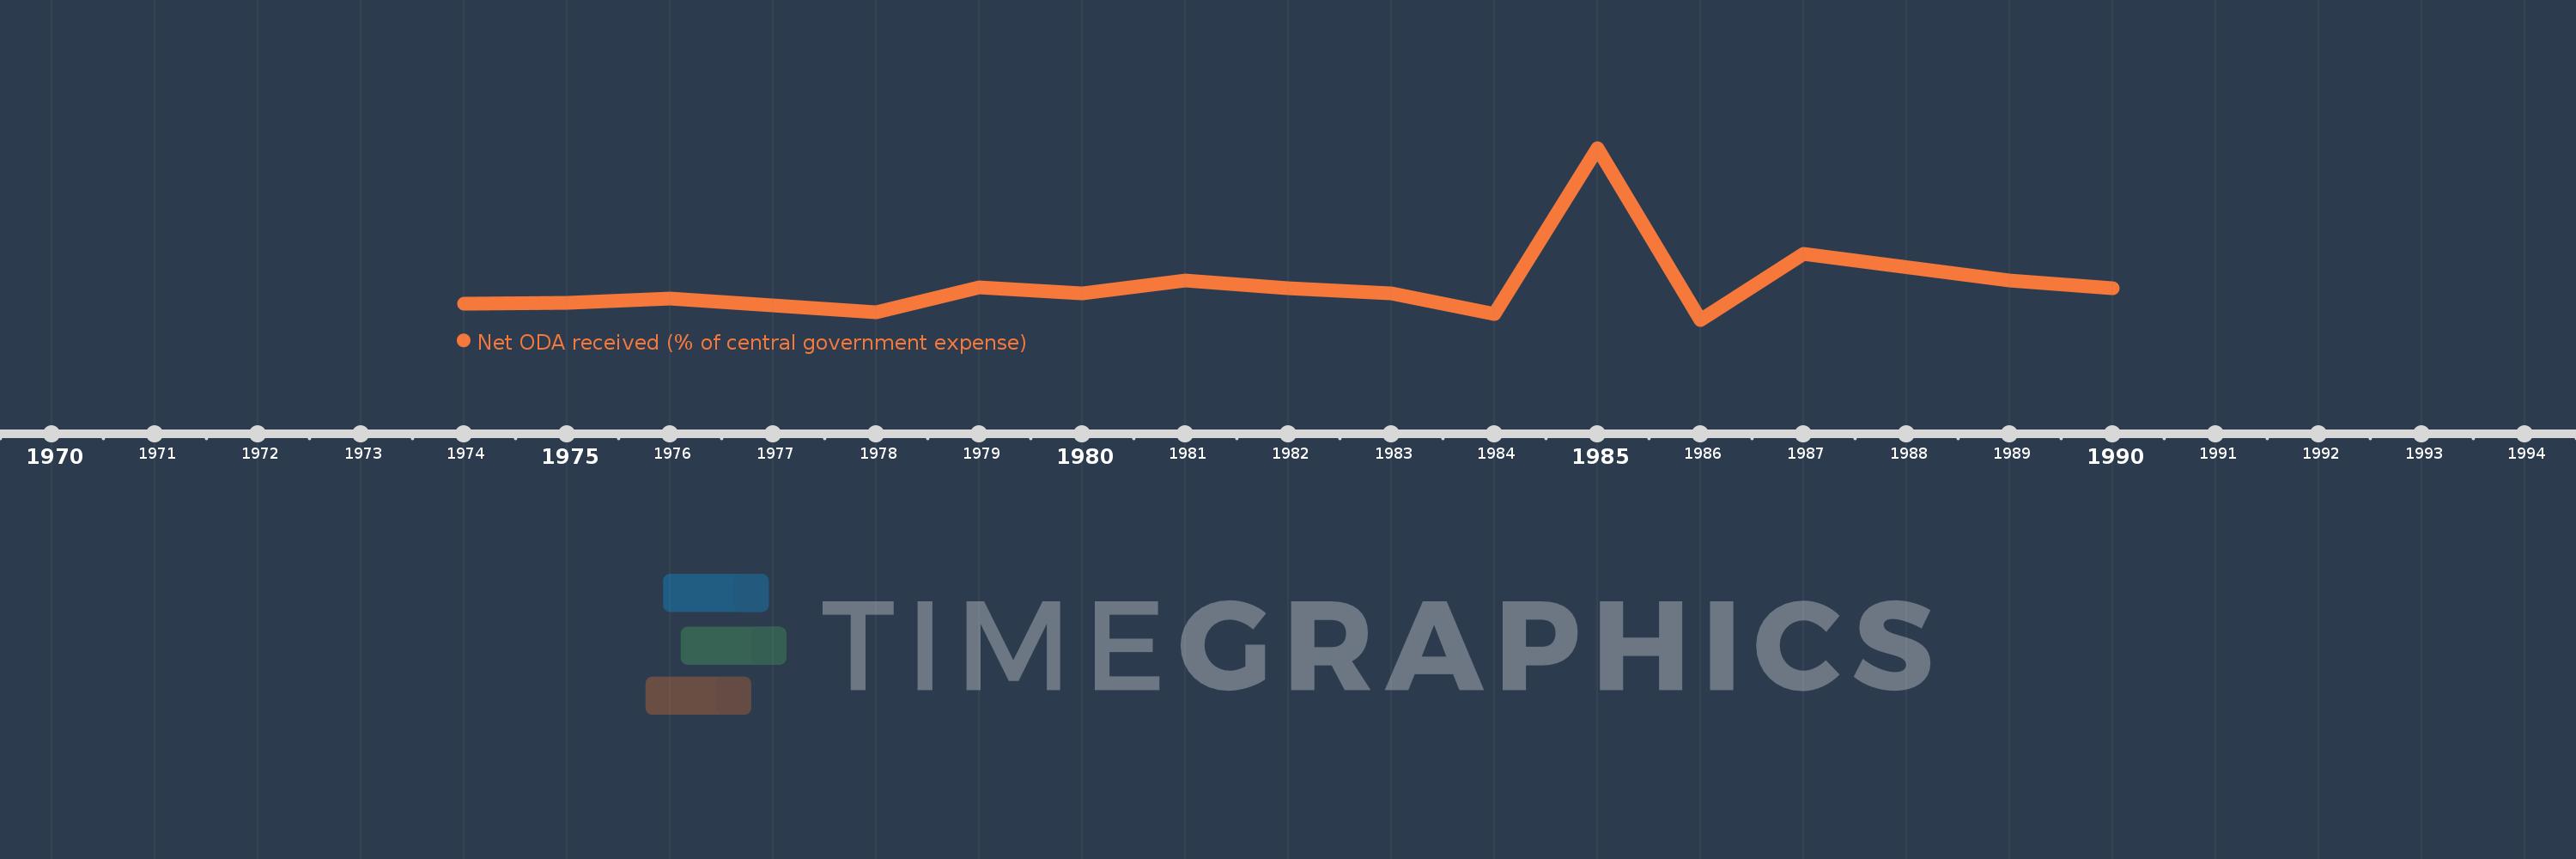
This timeline shows a graph from 1974 to 1990 of Bahamas, The. No data until 1973. Number of actual observations by date: 16.
Source name:
World Development Indicators
Source organization:
Development Assistance Committee of the Organisation for Economic Co-operation and Development, Geographical Distribution of Financial Flows to Developing Countries, Development Co-operation Report, and International Development Statistics database. Data are available online at: www.oecd.org/dac/stats/idsonline. IMF central government expense estimates are used for the denominator.
Categories, topics:
Aid Effectiveness
Last updated:
apr 23, 2017
Indicators value changes by year
Meaning:
0.813
Minimum:
0.194
jan 1, 1986
Maximum:
3.31
jan 1, 1985
At the date of observation
Value
Absolute change
Change from the previous value
jan 1, 1974
0.487
+0.487
0.0%
jan 1, 1975
0.502
+0.015
3.1%
jan 1, 1976
0.574
+0.072
14.33%
jan 1, 1977
0.456
-0.118
-20.62%
jan 1, 1978
0.335
-0.121
-26.63%
jan 1, 1979
0.788
+0.454
135.68%
jan 1, 1980
0.677
-0.111
-14.14%
jan 1, 1981
0.905
+0.228
33.69%
jan 1, 1982
0.765
-0.14
-15.47%
jan 1, 1983
0.676
-0.089
-11.69%
jan 1, 1984
0.295
-0.381
-56.39%
jan 1, 1985
3.31
+3.015
1.02K%
jan 1, 1986
0.194
-3.115
-94.13%
jan 1, 1987
1.386
+1.191
612.89%
jan 1, 1989
0.903
-0.483
-34.87%
jan 1, 1990
0.759
-0.143
-15.86%
Ranking of countries by current statistics by years