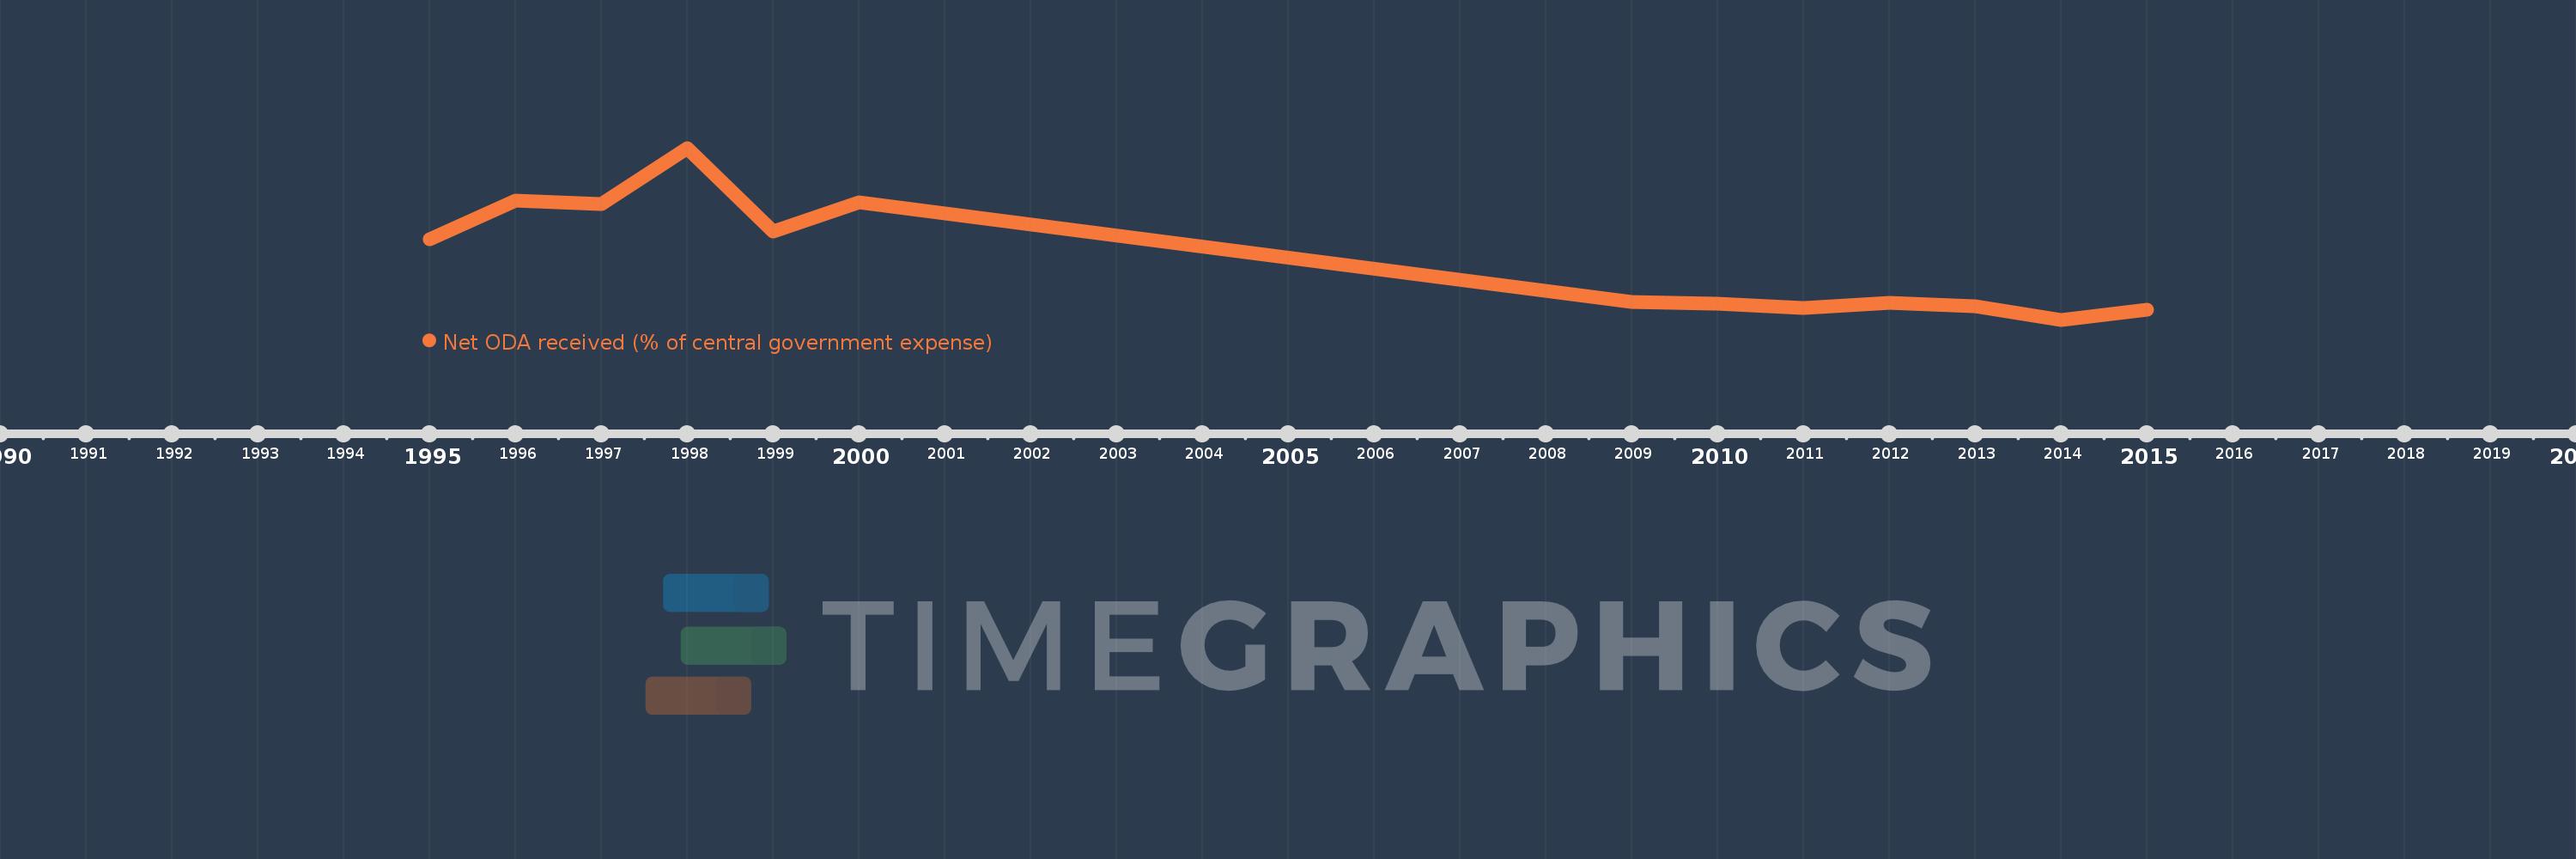
This timeline shows a graph from 1995 to 2015 of Azerbaijan. No data until 1994. Number of actual observations by date: 13.
Source name:
World Development Indicators
Source organization:
Development Assistance Committee of the Organisation for Economic Co-operation and Development, Geographical Distribution of Financial Flows to Developing Countries, Development Co-operation Report, and International Development Statistics database. Data are available online at: www.oecd.org/dac/stats/idsonline. IMF central government expense estimates are used for the denominator.
Categories, topics:
Aid Effectiveness
Last updated:
apr 23, 2017
Indicators value changes by year
Meaning:
9.686
Minimum:
-0.473
jan 1, 2014
Maximum:
28.634
jan 1, 1998
At the date of observation
Value
Absolute change
Change from the previous value
jan 1, 1995
13.151
+13.151
0.0%
jan 1, 1996
19.752
+6.601
50.19%
jan 1, 1997
19.189
-0.563
-2.85%
jan 1, 1998
28.634
+9.445
49.22%
jan 1, 1999
14.41
-14.224
-49.67%
jan 1, 2000
19.454
+5.044
35.0%
jan 1, 2009
2.601
-16.853
-86.63%
jan 1, 2010
2.268
-0.333
-12.81%
jan 1, 2011
1.45
-0.817
-36.04%
jan 1, 2012
2.352
+0.901
62.15%
jan 1, 2013
1.841
-0.511
-21.72%
jan 1, 2014
-0.473
-2.314
-125.68%
jan 1, 2015
1.294
+1.767
-373.7%
Ranking of countries by current statistics by years