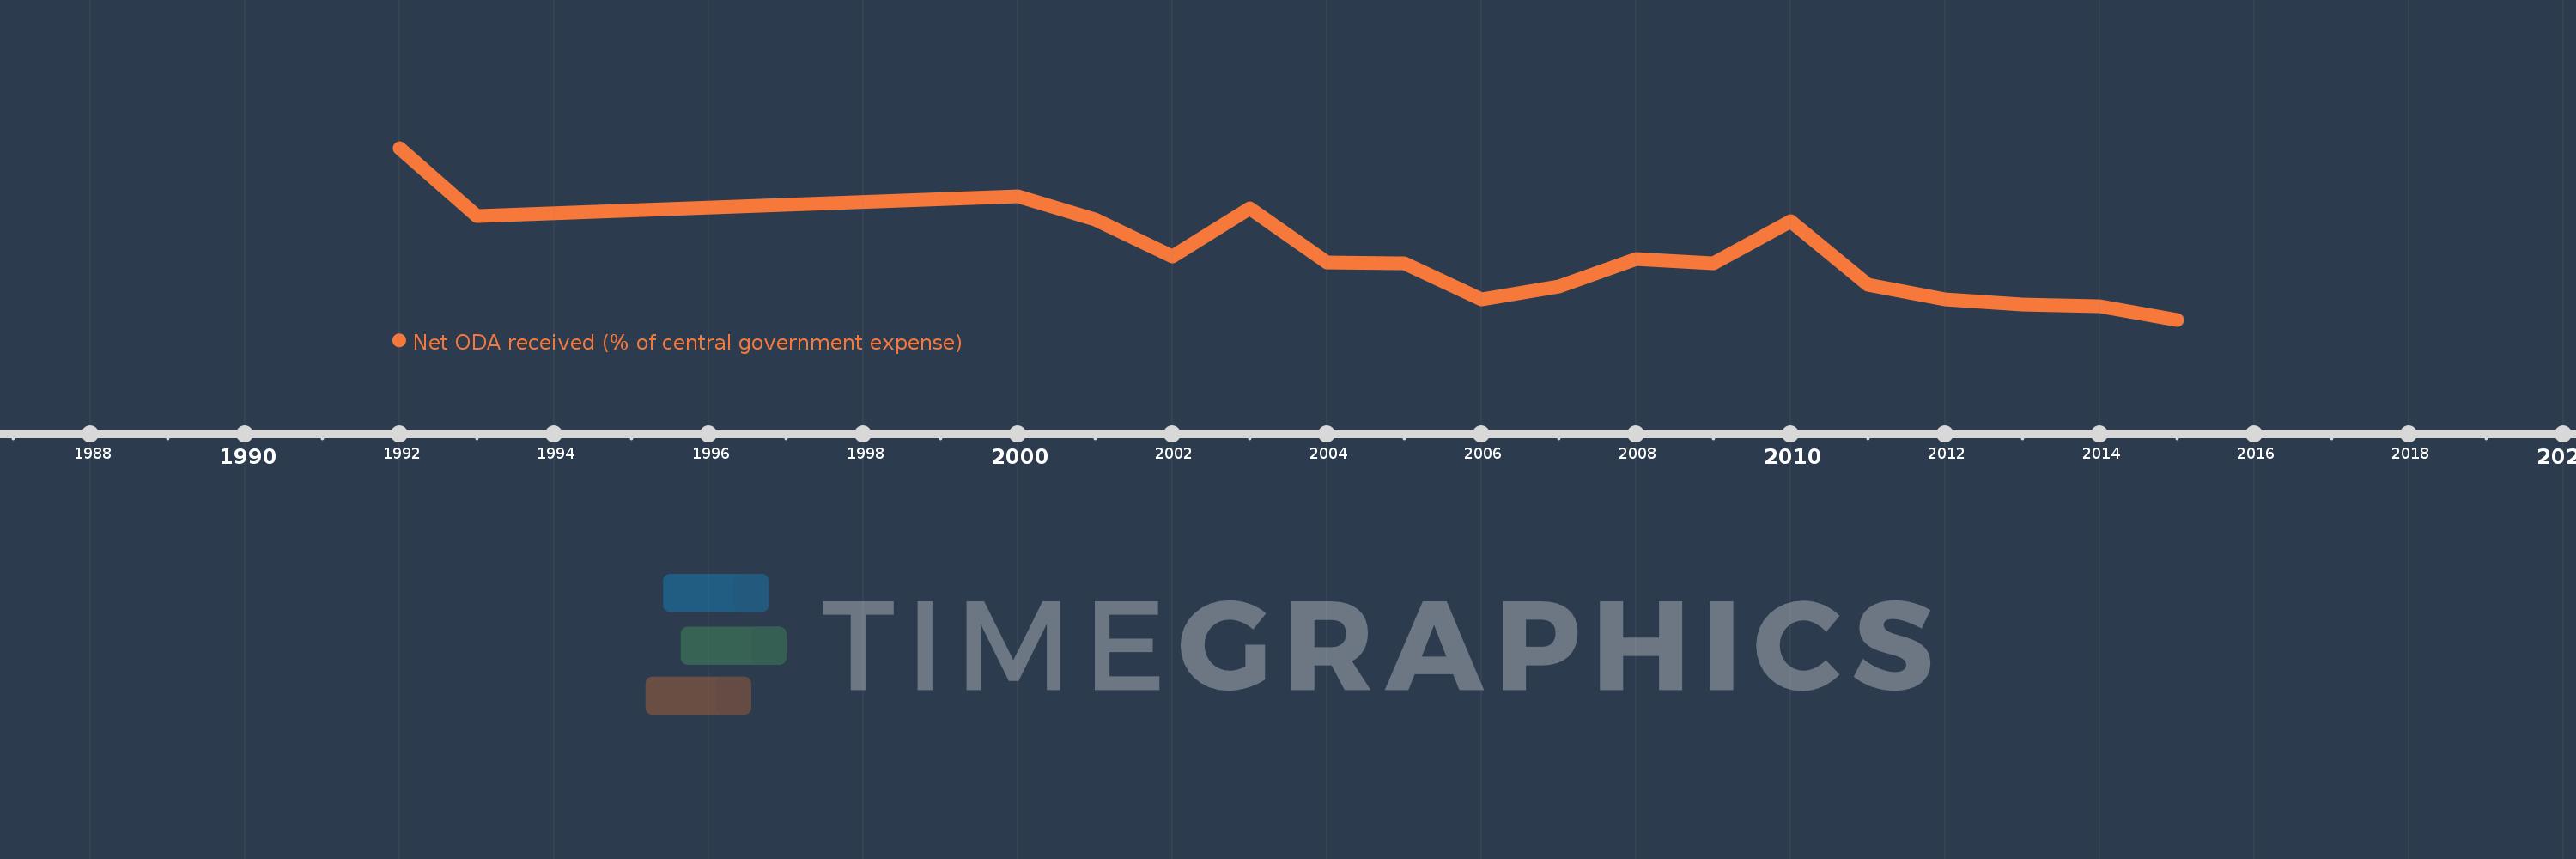
This timeline shows a graph from 1992 to 2015 of Namibia. No data until 1991. Number of actual observations by date: 18.
Source name:
World Development Indicators
Source organization:
Development Assistance Committee of the Organisation for Economic Co-operation and Development, Geographical Distribution of Financial Flows to Developing Countries, Development Co-operation Report, and International Development Statistics database. Data are available online at: www.oecd.org/dac/stats/idsonline. IMF central government expense estimates are used for the denominator.
Categories, topics:
Aid Effectiveness
Last updated:
apr 23, 2017
Indicators value changes by year
Meaning:
10.489
Minimum:
4.935
jan 1, 2015
Maximum:
19.985
jan 1, 1992
At the date of observation
Value
Absolute change
Change from the previous value
jan 1, 1992
19.985
+19.985
0.0%
jan 1, 1993
14.033
-5.953
-29.79%
jan 1, 2000
15.778
+1.745
12.44%
jan 1, 2001
13.682
-2.096
-13.29%
jan 1, 2002
10.493
-3.189
-23.31%
jan 1, 2003
14.696
+4.203
40.06%
jan 1, 2004
9.981
-4.715
-32.08%
jan 1, 2005
9.908
-0.074
-0.74%
jan 1, 2006
6.723
-3.185
-32.14%
jan 1, 2007
7.837
+1.114
16.57%
jan 1, 2008
10.252
+2.415
30.82%
jan 1, 2009
9.878
-0.374
-3.65%
jan 1, 2010
13.591
+3.712
37.58%
jan 1, 2011
7.983
-5.608
-41.26%
jan 1, 2012
6.692
-1.291
-16.17%
jan 1, 2013
6.267
-0.426
-6.36%
jan 1, 2014
6.082
-0.185
-2.95%
jan 1, 2015
4.935
-1.147
-18.86%
Ranking of countries by current statistics by years