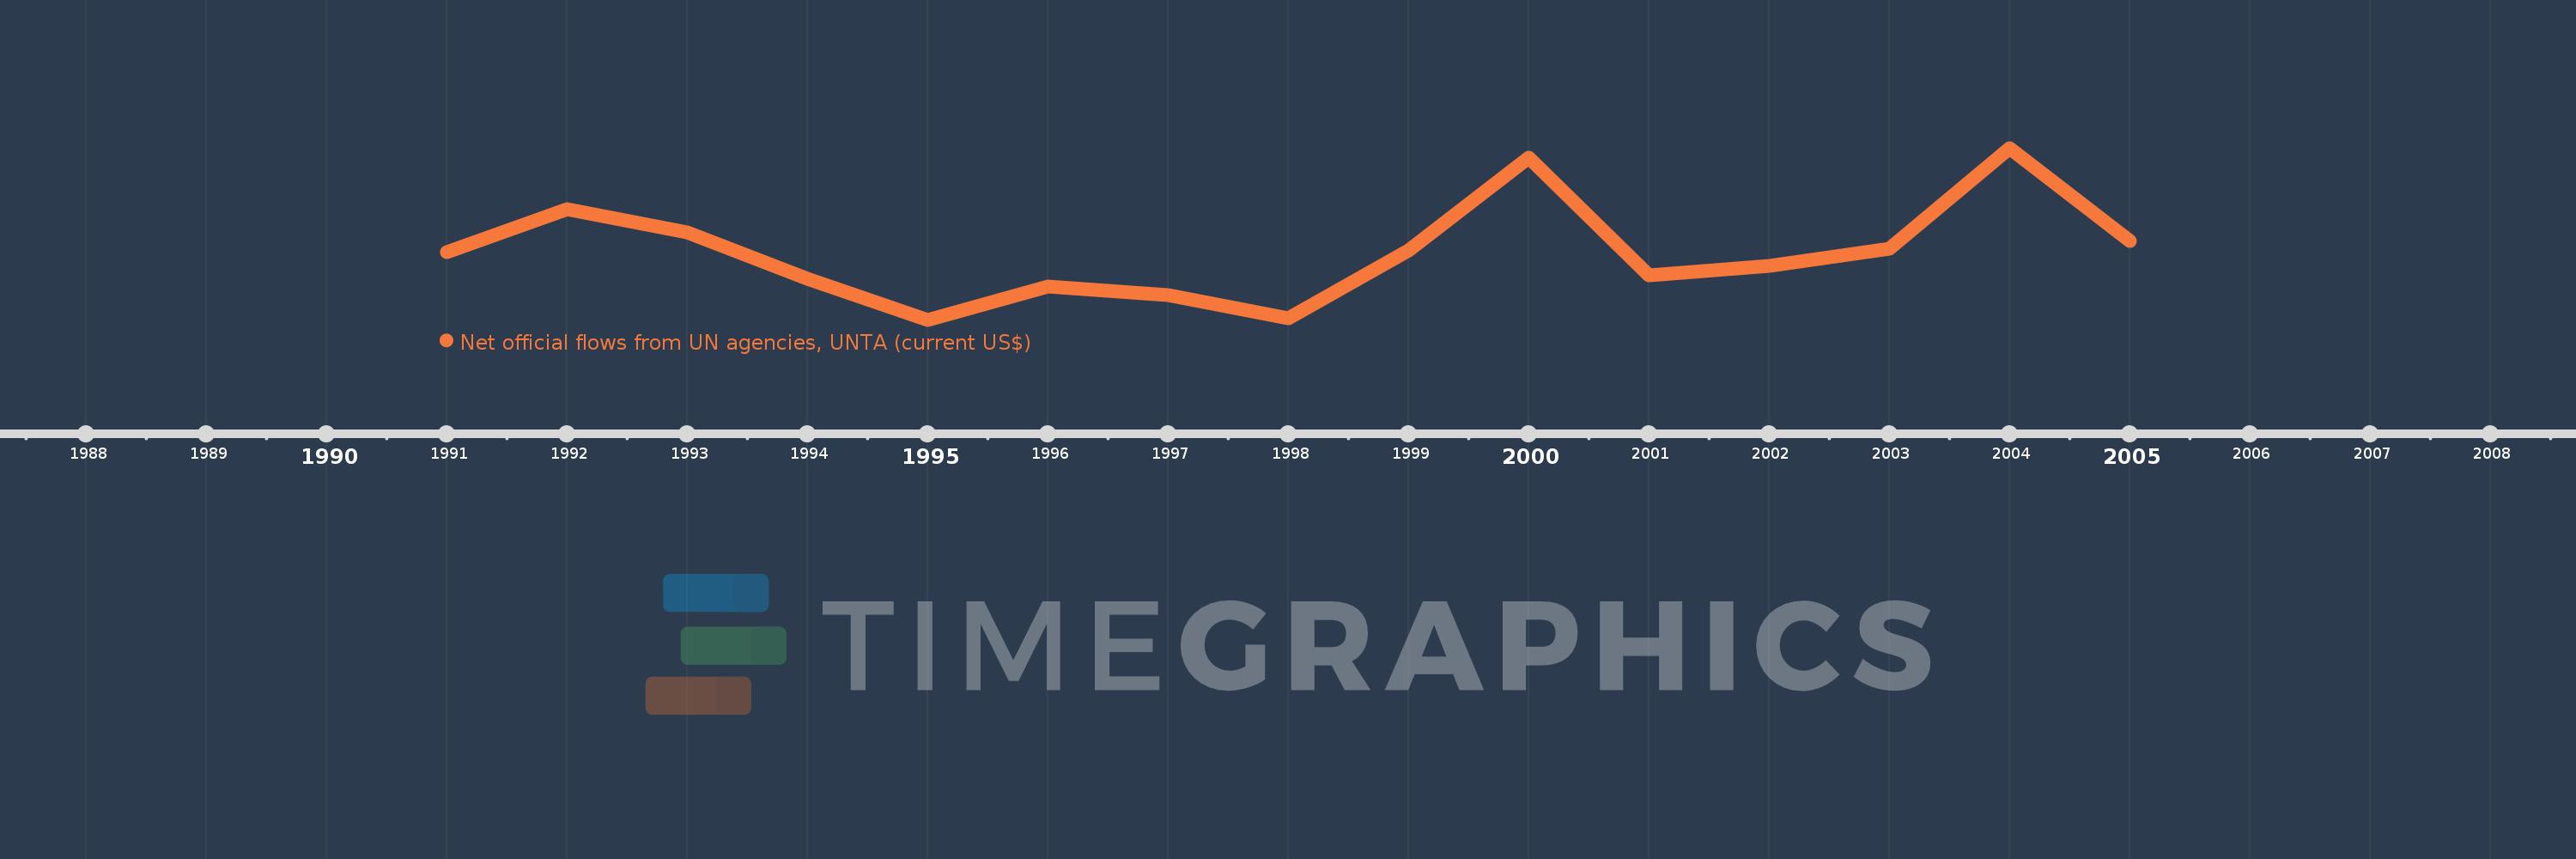
This timeline shows a graph from 1991 to 2005 of Bulgaria. No data until 1990. Number of actual observations by date: 15.
Source name:
World Development Indicators
Source organization:
Development Assistance Committee of the Organisation for Economic Co-operation and Development, Geographical Distribution of Financial Flows to Developing Countries, Development Co-operation Report, and International Development Statistics database. Data are available online at: www.oecd.org/dac/stats/idsonline.
Categories, topics:
Aid Effectiveness
Last updated:
apr 23, 2017
Indicators value changes by year
Meaning:
863.333K
Minimum:
500.0K
jan 1, 1995
Maximum:
1.42 mln
jan 1, 2004
At the date of observation
Value
Absolute change
Change from the previous value
jan 1, 1991
860.0K
+860.0K
0.0%
jan 1, 1992
1.09 mln
+230.0K
26.74%
jan 1, 1993
970.0K
-120.0K
-11.01%
jan 1, 1994
720.0K
-250.0K
-25.77%
jan 1, 1995
500.0K
-220.0K
-30.56%
jan 1, 1996
680.0K
+180.0K
36.0%
jan 1, 1997
630.0K
-50.0K
-7.35%
jan 1, 1998
510.0K
-120.0K
-19.05%
jan 1, 1999
870.0K
+360.0K
70.59%
jan 1, 2000
1.37 mln
+500.0K
57.47%
jan 1, 2001
740.0K
-630.0K
-45.99%
jan 1, 2002
790.0K
+50.0K
6.76%
jan 1, 2003
880.0K
+90.0K
11.39%
jan 1, 2004
1.42 mln
+540.0K
61.36%
jan 1, 2005
920.0K
-500.0K
-35.21%
Ranking of countries by current statistics by years