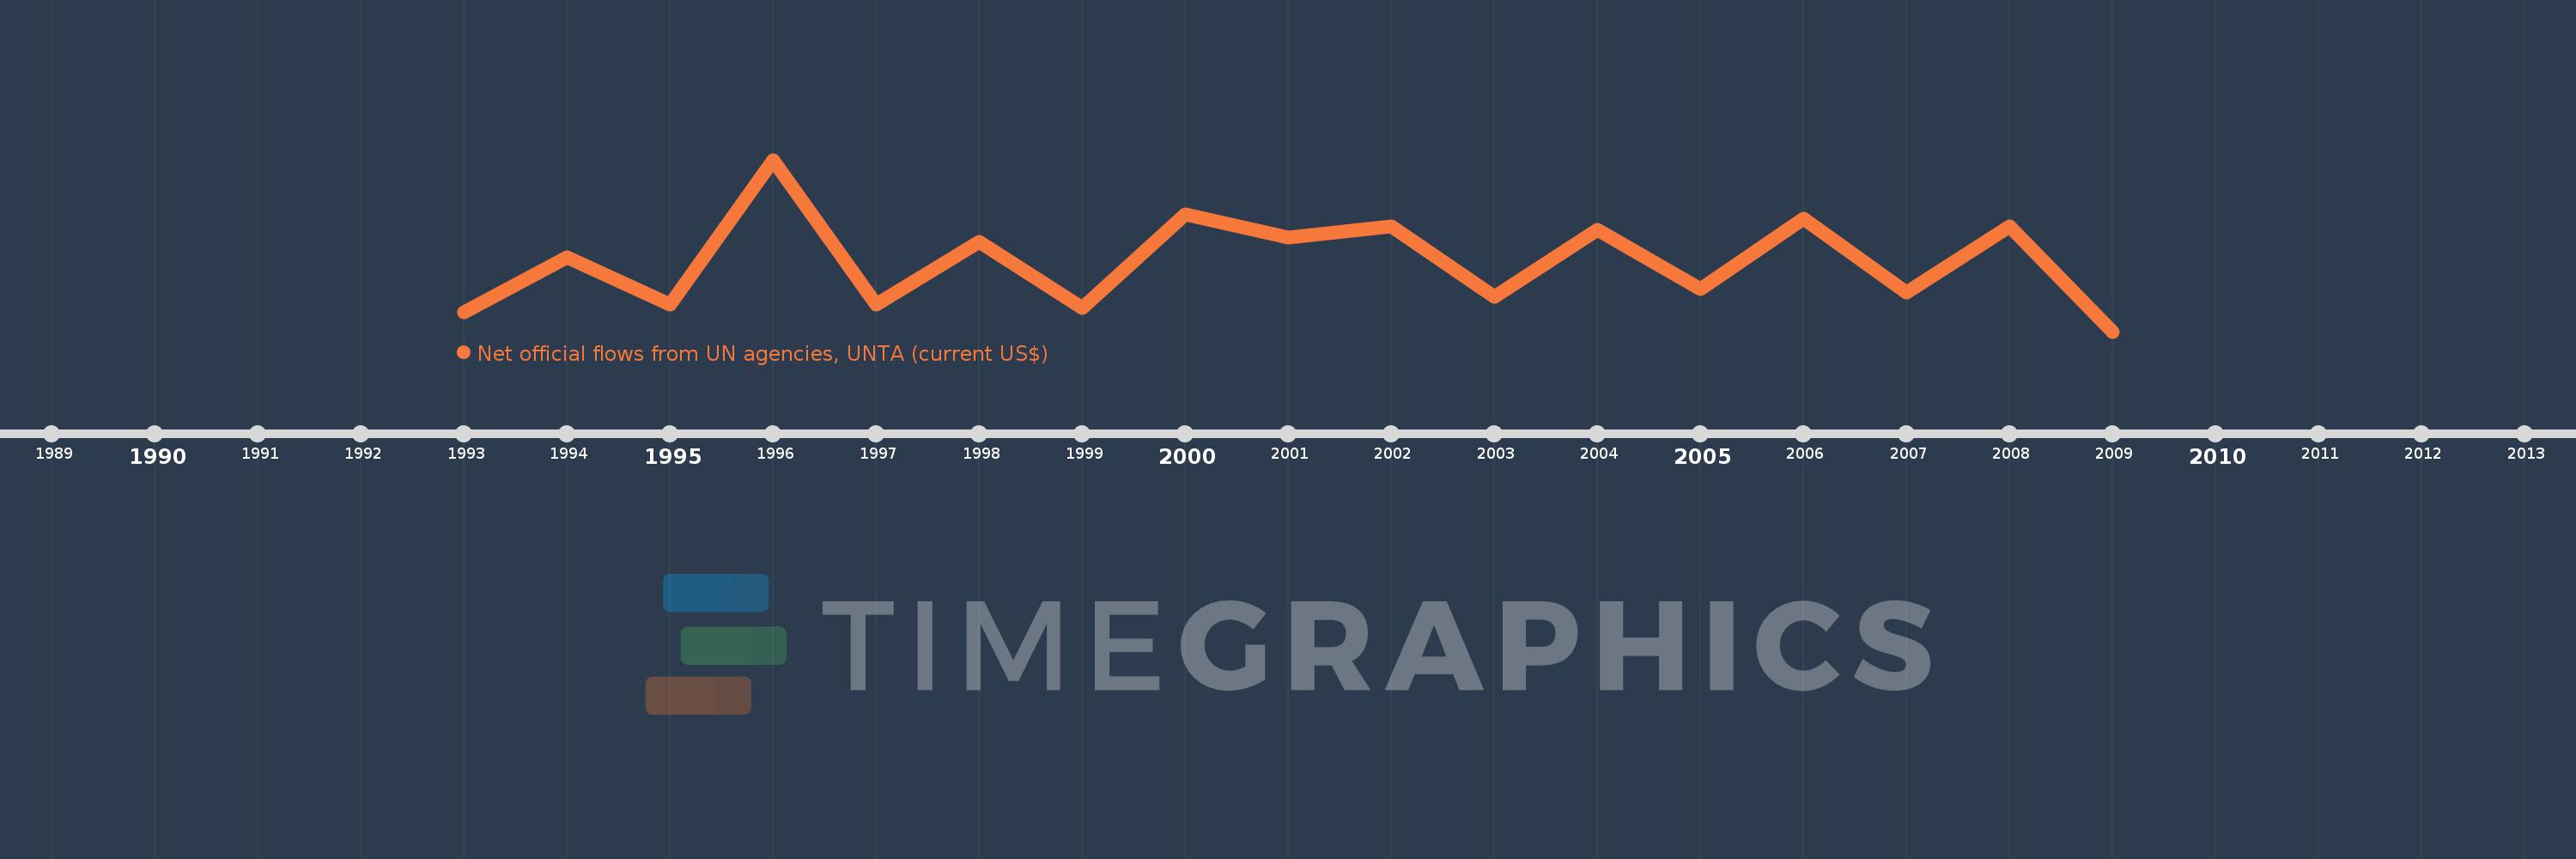
This timeline shows a graph from 1993 to 2009 of Micronesia, Fed. Sts.. No data until 1992. Number of actual observations by date: 17.
Source name:
World Development Indicators
Source organization:
Development Assistance Committee of the Organisation for Economic Co-operation and Development, Geographical Distribution of Financial Flows to Developing Countries, Development Co-operation Report, and International Development Statistics database. Data are available online at: www.oecd.org/dac/stats/idsonline.
Categories, topics:
Aid Effectiveness
Last updated:
apr 23, 2017
Indicators value changes by year
Meaning:
208.824K
Minimum:
30.0K
jan 1, 2009
Maximum:
470.0K
jan 1, 1996
At the date of observation
Value
Absolute change
Change from the previous value
jan 1, 1993
80.0K
+80.0K
0.0%
jan 1, 1994
220.0K
+140.0K
175.0%
jan 1, 1995
100.0K
-120.0K
-54.55%
jan 1, 1996
470.0K
+370.0K
370.0%
jan 1, 1997
100.0K
-370.0K
-78.72%
jan 1, 1998
260.0K
+160.0K
160.0%
jan 1, 1999
90.0K
-170.0K
-65.38%
jan 1, 2000
330.0K
+240.0K
266.67%
jan 1, 2001
270.0K
-60.0K
-18.18%
jan 1, 2002
300.0K
+30.0K
11.11%
jan 1, 2003
120.0K
-180.0K
-60.0%
jan 1, 2004
290.0K
+170.0K
141.67%
jan 1, 2005
140.0K
-150.0K
-51.72%
jan 1, 2006
320.0K
+180.0K
128.57%
jan 1, 2007
130.0K
-190.0K
-59.38%
jan 1, 2008
300.0K
+170.0K
130.77%
jan 1, 2009
30.0K
-270.0K
-90.0%
Ranking of countries by current statistics by years