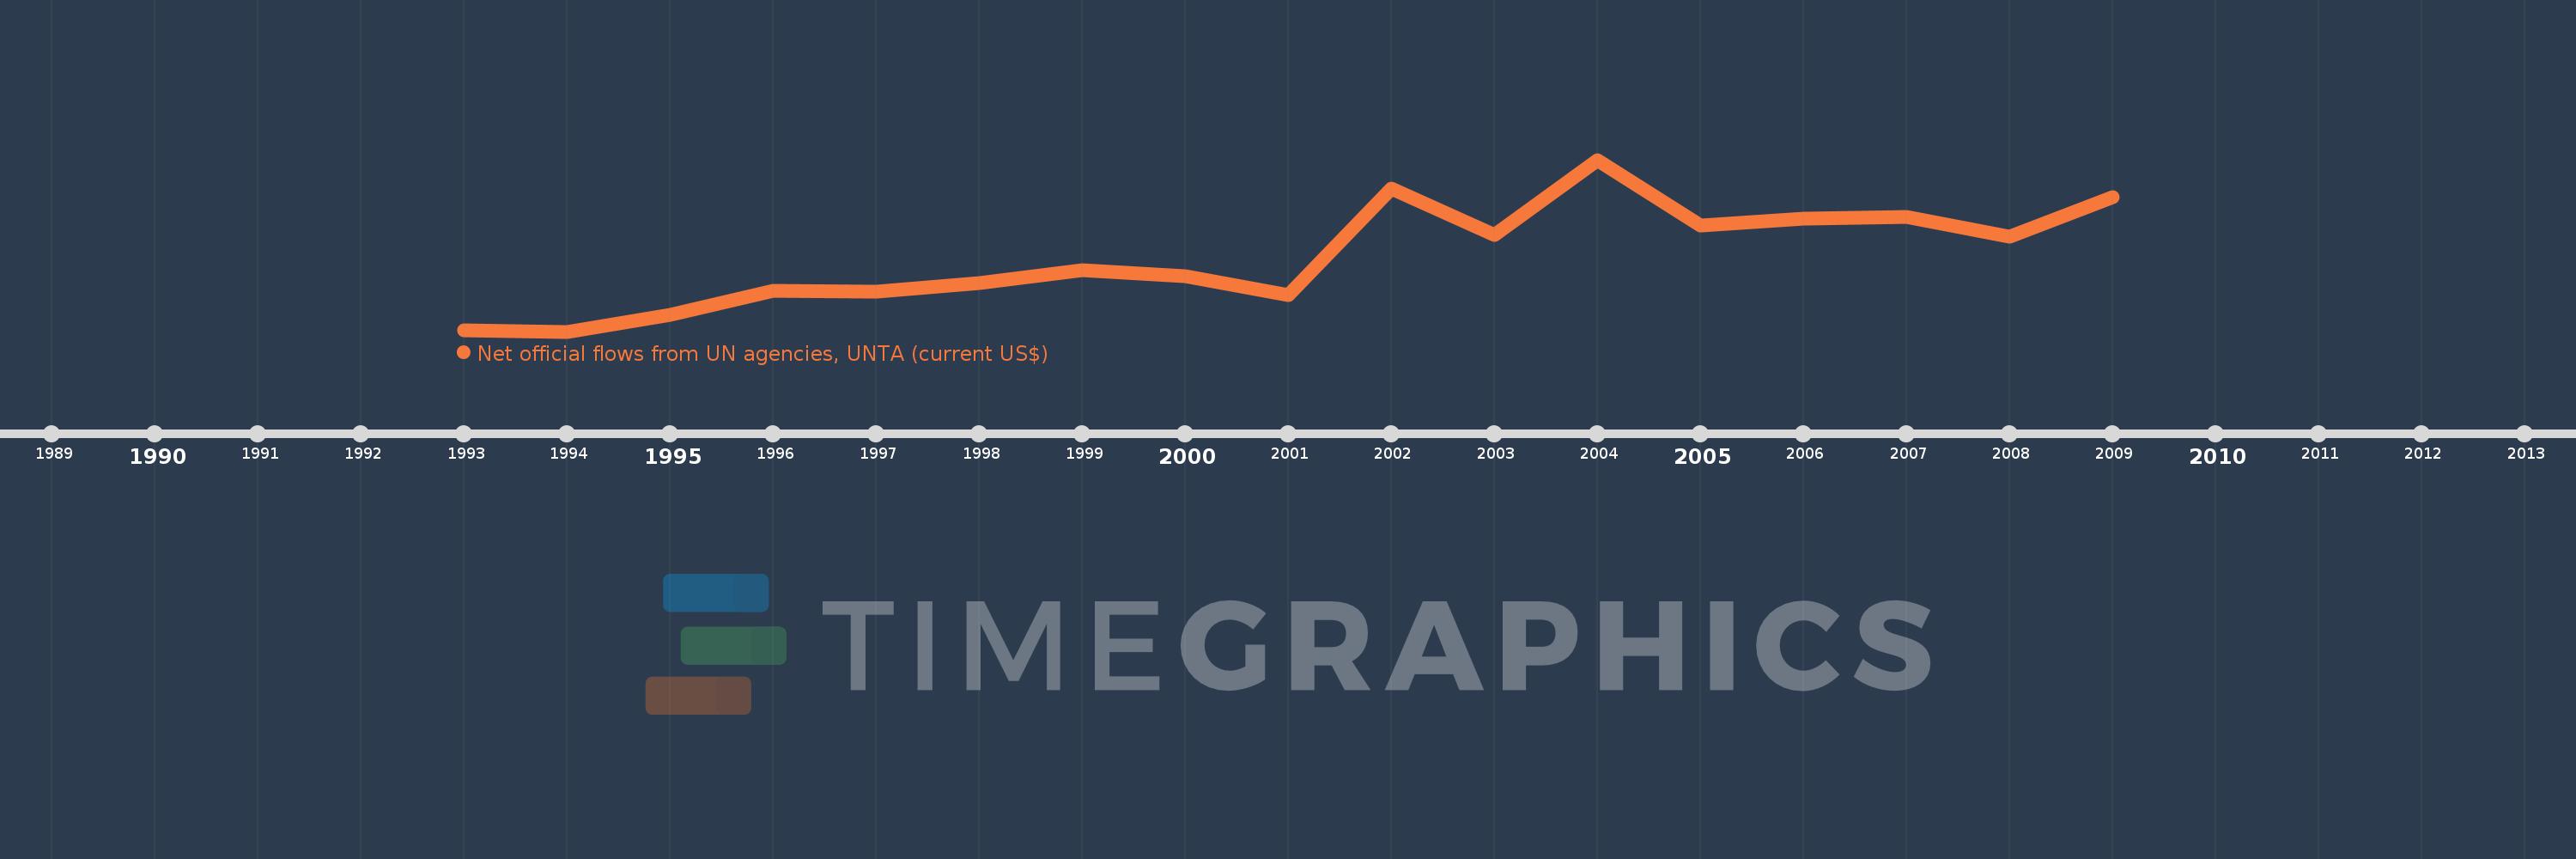
This timeline shows a graph from 1993 to 2009 of Armenia. No data until 1992. Number of actual observations by date: 17.
Source name:
World Development Indicators
Source organization:
Development Assistance Committee of the Organisation for Economic Co-operation and Development, Geographical Distribution of Financial Flows to Developing Countries, Development Co-operation Report, and International Development Statistics database. Data are available online at: www.oecd.org/dac/stats/idsonline.
Categories, topics:
Aid Effectiveness
Last updated:
apr 23, 2017
Indicators value changes by year
Meaning:
938.235K
Minimum:
70.0K
jan 1, 1994
Maximum:
2.06 mln
jan 1, 2004
At the date of observation
Value
Absolute change
Change from the previous value
jan 1, 1993
80.0K
+80.0K
0.0%
jan 1, 1994
70.0K
-10.0K
-12.5%
jan 1, 1995
260.0K
+190.0K
271.43%
jan 1, 1996
540.0K
+280.0K
107.69%
jan 1, 1997
530.0K
-10.0K
-1.85%
jan 1, 1998
630.0K
+100.0K
18.87%
jan 1, 1999
780.0K
+150.0K
23.81%
jan 1, 2000
710.0K
-70.0K
-8.97%
jan 1, 2001
490.0K
-220.0K
-30.99%
jan 1, 2002
1.73 mln
+1.24 mln
253.06%
jan 1, 2003
1.19 mln
-540.0K
-31.21%
jan 1, 2004
2.06 mln
+870.0K
73.11%
jan 1, 2005
1.3 mln
-760.0K
-36.89%
jan 1, 2006
1.38 mln
+80.0K
6.15%
jan 1, 2007
1.4 mln
+20.0K
1.45%
jan 1, 2008
1.17 mln
-230.0K
-16.43%
jan 1, 2009
1.63 mln
+460.0K
39.32%
Ranking of countries by current statistics by years