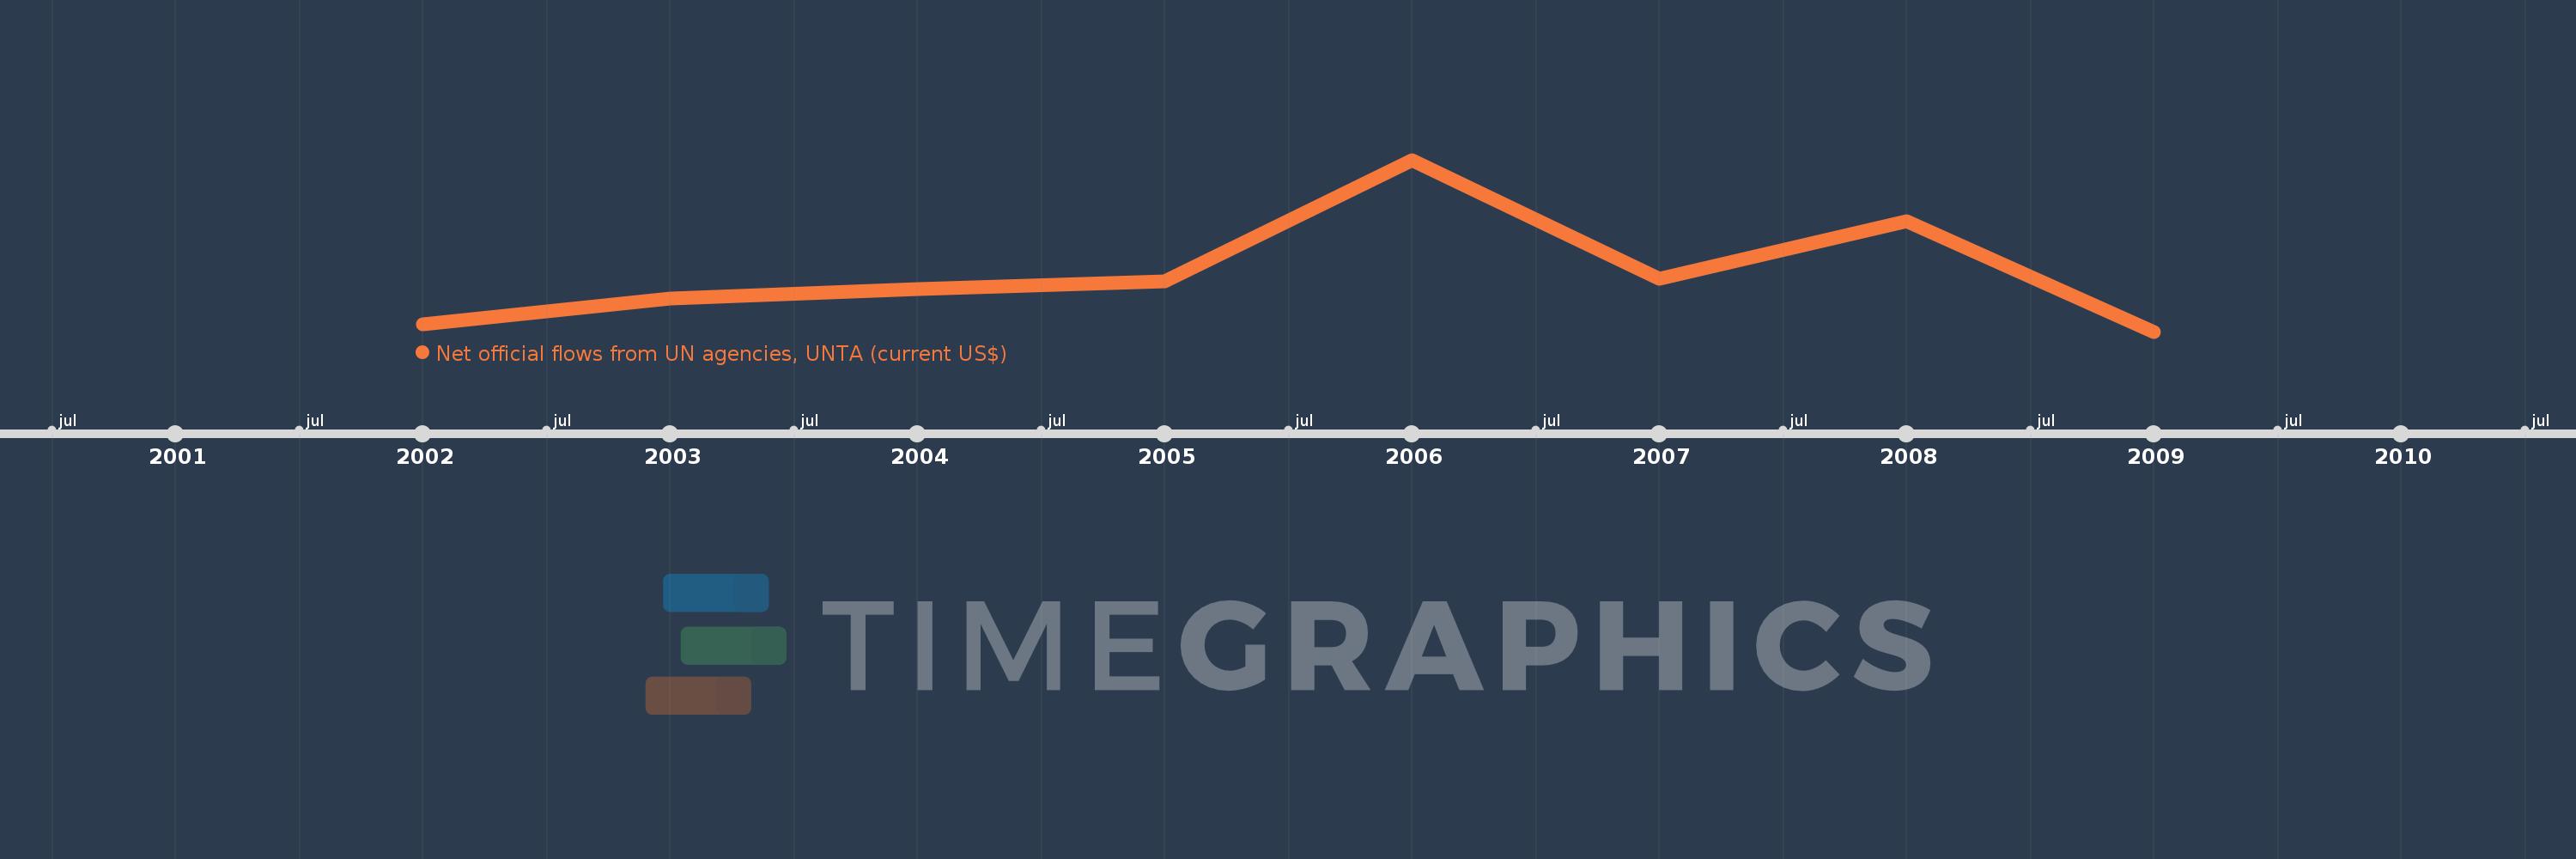
This timeline shows a graph from 2002 to 2009 of Timor-Leste. No data until 2001. Number of actual observations by date: 8.
Source name:
World Development Indicators
Source organization:
Development Assistance Committee of the Organisation for Economic Co-operation and Development, Geographical Distribution of Financial Flows to Developing Countries, Development Co-operation Report, and International Development Statistics database. Data are available online at: www.oecd.org/dac/stats/idsonline.
Categories, topics:
Aid Effectiveness
Last updated:
apr 23, 2017
Indicators value changes by year
Meaning:
966.25K
Minimum:
510.0K
jan 1, 2009
Maximum:
1.85 mln
jan 1, 2006
At the date of observation
Value
Absolute change
Change from the previous value
jan 1, 2002
570.0K
+570.0K
0.0%
jan 1, 2003
770.0K
+200.0K
35.09%
jan 1, 2004
840.0K
+70.0K
9.09%
jan 1, 2005
900.0K
+60.0K
7.14%
jan 1, 2006
1.85 mln
+950.0K
105.56%
jan 1, 2007
920.0K
-930.0K
-50.27%
jan 1, 2008
1.37 mln
+450.0K
48.91%
jan 1, 2009
510.0K
-860.0K
-62.77%
Ranking of countries by current statistics by years