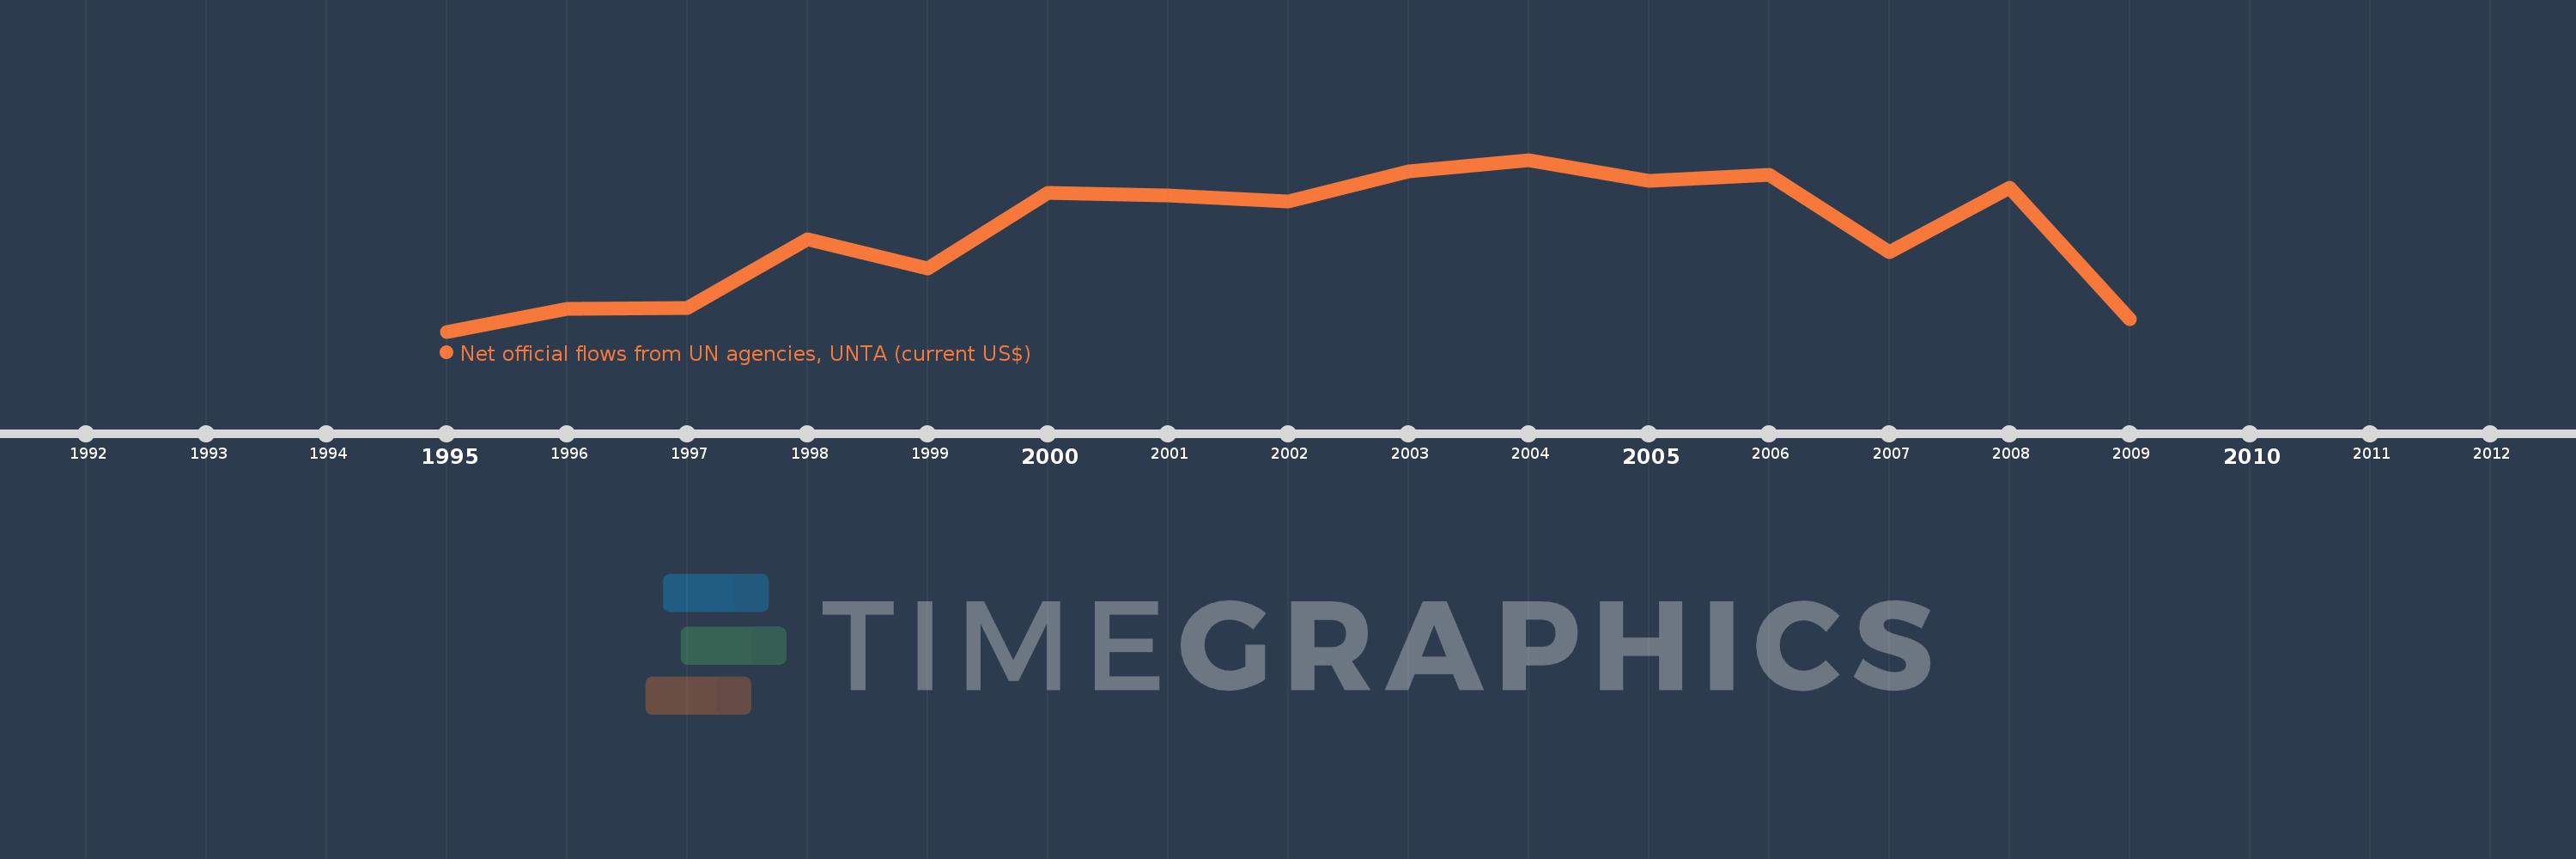
This timeline shows a graph from 1995 to 2009 of South Africa. No data until 1994. Number of actual observations by date: 15.
Source name:
World Development Indicators
Source organization:
Development Assistance Committee of the Organisation for Economic Co-operation and Development, Geographical Distribution of Financial Flows to Developing Countries, Development Co-operation Report, and International Development Statistics database. Data are available online at: www.oecd.org/dac/stats/idsonline.
Categories, topics:
Aid Effectiveness
Last updated:
apr 23, 2017
Indicators value changes by year
Meaning:
2.063 mln
Minimum:
250.0K
jan 1, 1995
Maximum:
3.4 mln
jan 1, 2004
At the date of observation
Value
Absolute change
Change from the previous value
jan 1, 1995
250.0K
+250.0K
0.0%
jan 1, 1996
660.0K
+410.0K
164.0%
jan 1, 1997
690.0K
+30.0K
4.55%
jan 1, 1998
1.94 mln
+1.25 mln
181.16%
jan 1, 1999
1.41 mln
-530.0K
-27.32%
jan 1, 2000
2.8 mln
+1.39 mln
98.58%
jan 1, 2001
2.75 mln
-50.0K
-1.79%
jan 1, 2002
2.63 mln
-120.0K
-4.36%
jan 1, 2003
3.18 mln
+550.0K
20.91%
jan 1, 2004
3.4 mln
+220.0K
6.92%
jan 1, 2005
3.02 mln
-380.0K
-11.18%
jan 1, 2006
3.13 mln
+110.0K
3.64%
jan 1, 2007
1.71 mln
-1.42 mln
-45.37%
jan 1, 2008
2.89 mln
+1.18 mln
69.01%
jan 1, 2009
480.0K
-2.41 mln
-83.39%
Ranking of countries by current statistics by years