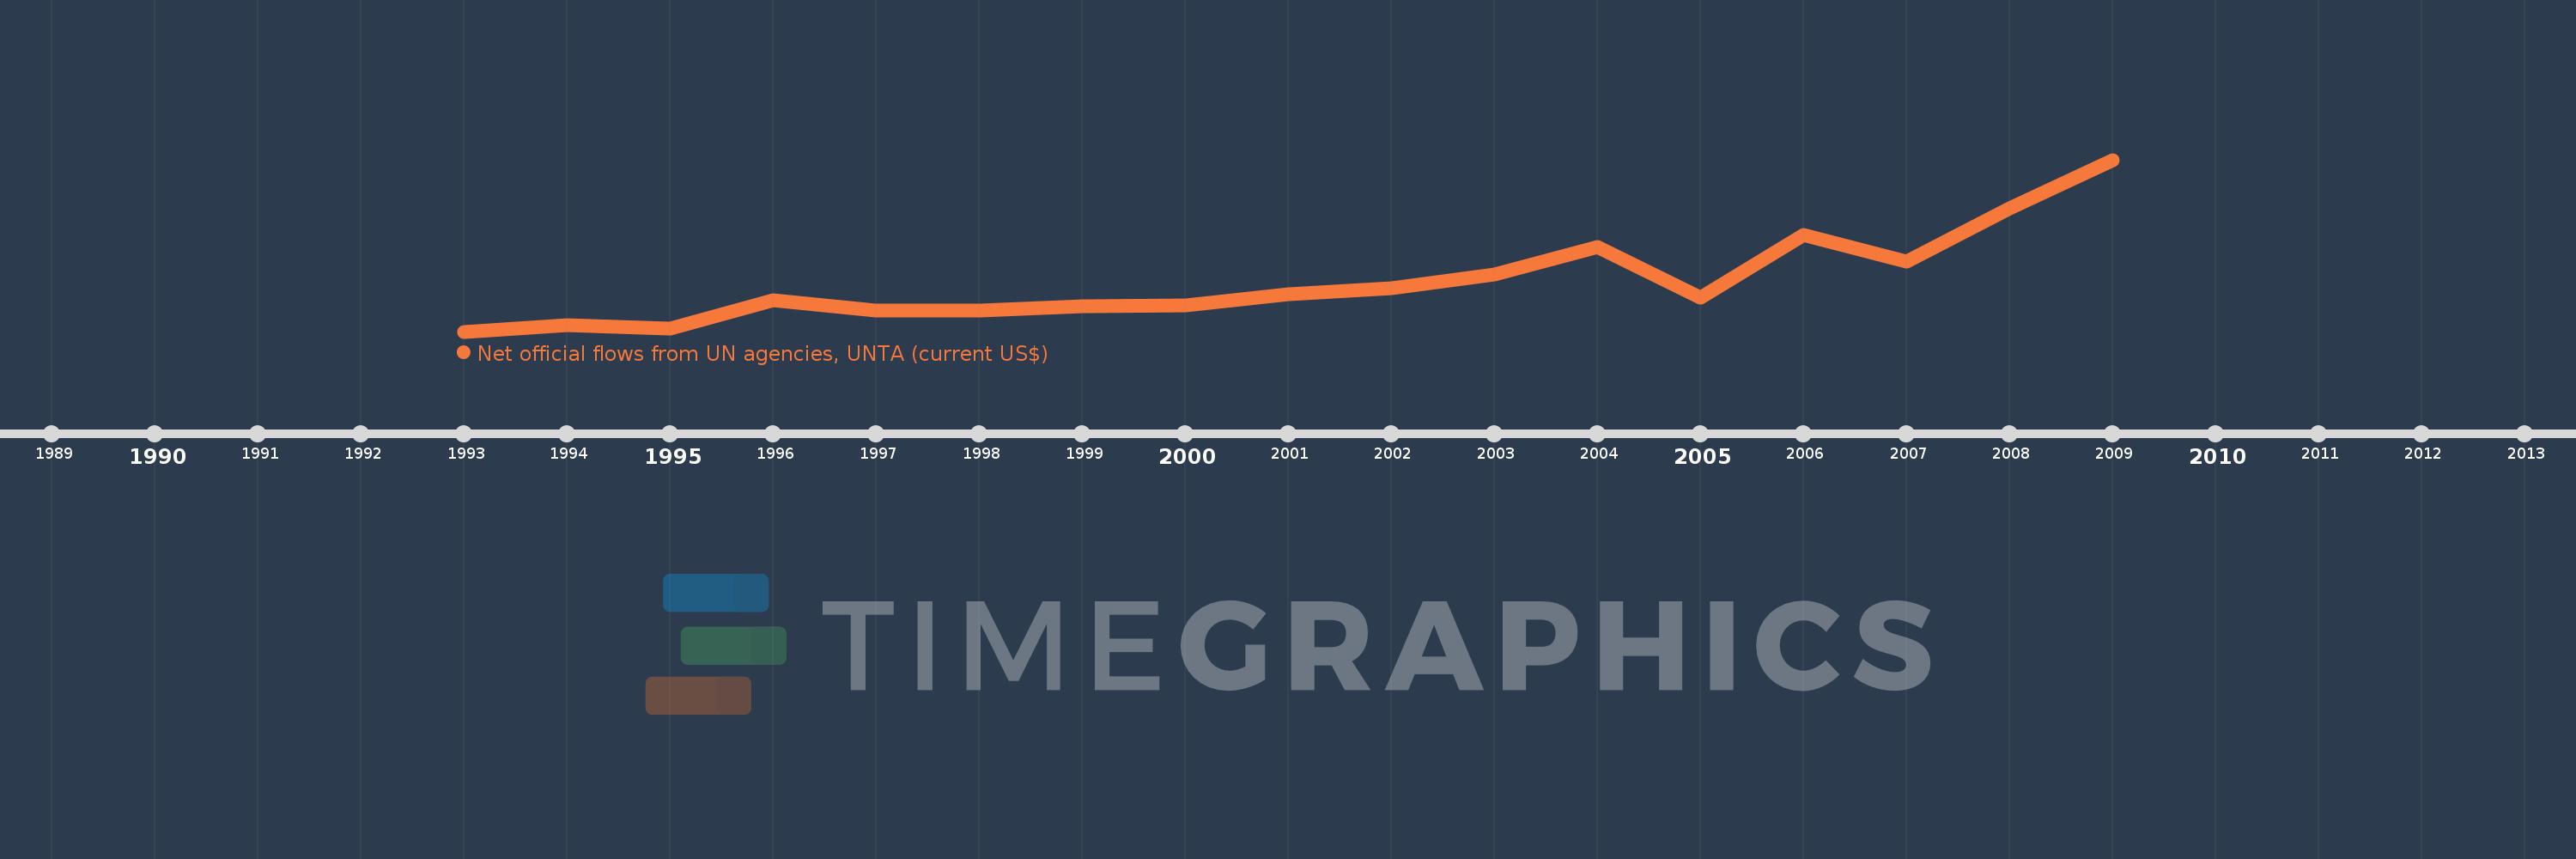
This timeline shows a graph from 1993 to 2009 of Kyrgyz Republic. No data until 1992. Number of actual observations by date: 17.
Source name:
World Development Indicators
Source organization:
Development Assistance Committee of the Organisation for Economic Co-operation and Development, Geographical Distribution of Financial Flows to Developing Countries, Development Co-operation Report, and International Development Statistics database. Data are available online at: www.oecd.org/dac/stats/idsonline.
Categories, topics:
Aid Effectiveness
Last updated:
apr 23, 2017
Indicators value changes by year
Meaning:
409.412K
Minimum:
30.0K
jan 1, 1993
Maximum:
1.33 mln
jan 1, 2009
At the date of observation
Value
Absolute change
Change from the previous value
jan 1, 1993
30.0K
+30.0K
0.0%
jan 1, 1994
80.0K
+50.0K
166.67%
jan 1, 1995
50.0K
-30.0K
-37.5%
jan 1, 1996
270.0K
+220.0K
440.0%
jan 1, 1997
190.0K
-80.0K
-29.63%
jan 1, 1998
190.0K
0.0
0.0%
jan 1, 1999
220.0K
+30.0K
15.79%
jan 1, 2000
230.0K
+10.0K
4.55%
jan 1, 2001
310.0K
+80.0K
34.78%
jan 1, 2002
360.0K
+50.0K
16.13%
jan 1, 2003
460.0K
+100.0K
27.78%
jan 1, 2004
670.0K
+210.0K
45.65%
jan 1, 2005
290.0K
-380.0K
-56.72%
jan 1, 2006
760.0K
+470.0K
162.07%
jan 1, 2007
560.0K
-200.0K
-26.32%
jan 1, 2008
960.0K
+400.0K
71.43%
jan 1, 2009
1.33 mln
+370.0K
38.54%
Ranking of countries by current statistics by years