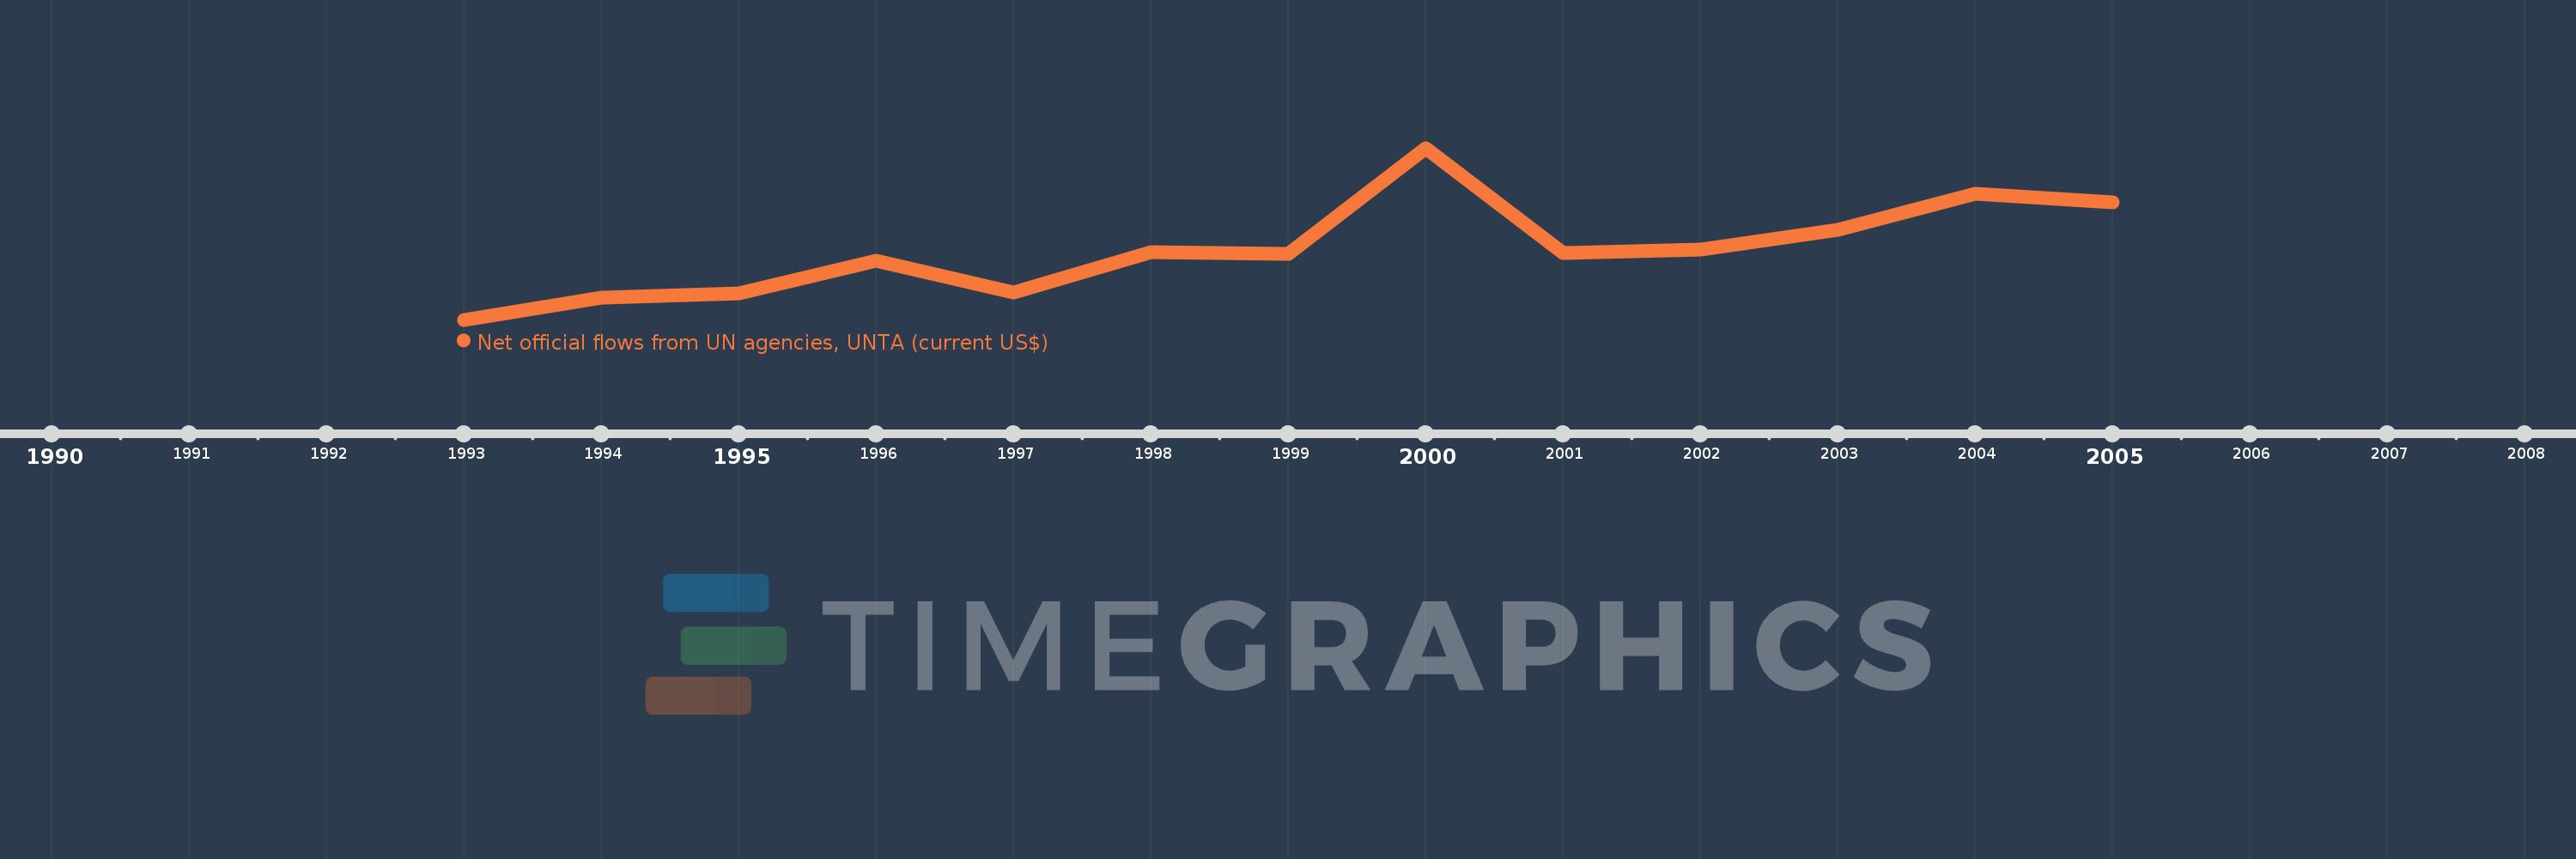
This timeline shows a graph from 1993 to 2005 of Russian Federation. No data until 1992. Number of actual observations by date: 13.
Source name:
World Development Indicators
Source organization:
Development Assistance Committee of the Organisation for Economic Co-operation and Development, Geographical Distribution of Financial Flows to Developing Countries, Development Co-operation Report, and International Development Statistics database. Data are available online at: www.oecd.org/dac/stats/idsonline.
Categories, topics:
Aid Effectiveness
Last updated:
apr 23, 2017
Indicators value changes by year
Meaning:
576.923K
Minimum:
10.0K
jan 1, 1993
Maximum:
1.4 mln
jan 1, 2000
At the date of observation
Value
Absolute change
Change from the previous value
jan 1, 1993
10.0K
+10.0K
0.0%
jan 1, 1994
190.0K
+180.0K
1.8K%
jan 1, 1995
220.0K
+30.0K
15.79%
jan 1, 1996
490.0K
+270.0K
122.73%
jan 1, 1997
230.0K
-260.0K
-53.06%
jan 1, 1998
560.0K
+330.0K
143.48%
jan 1, 1999
540.0K
-20.0K
-3.57%
jan 1, 2000
1.4 mln
+860.0K
159.26%
jan 1, 2001
550.0K
-850.0K
-60.71%
jan 1, 2002
580.0K
+30.0K
5.45%
jan 1, 2003
740.0K
+160.0K
27.59%
jan 1, 2004
1.03 mln
+290.0K
39.19%
jan 1, 2005
960.0K
-70.0K
-6.8%
Ranking of countries by current statistics by years