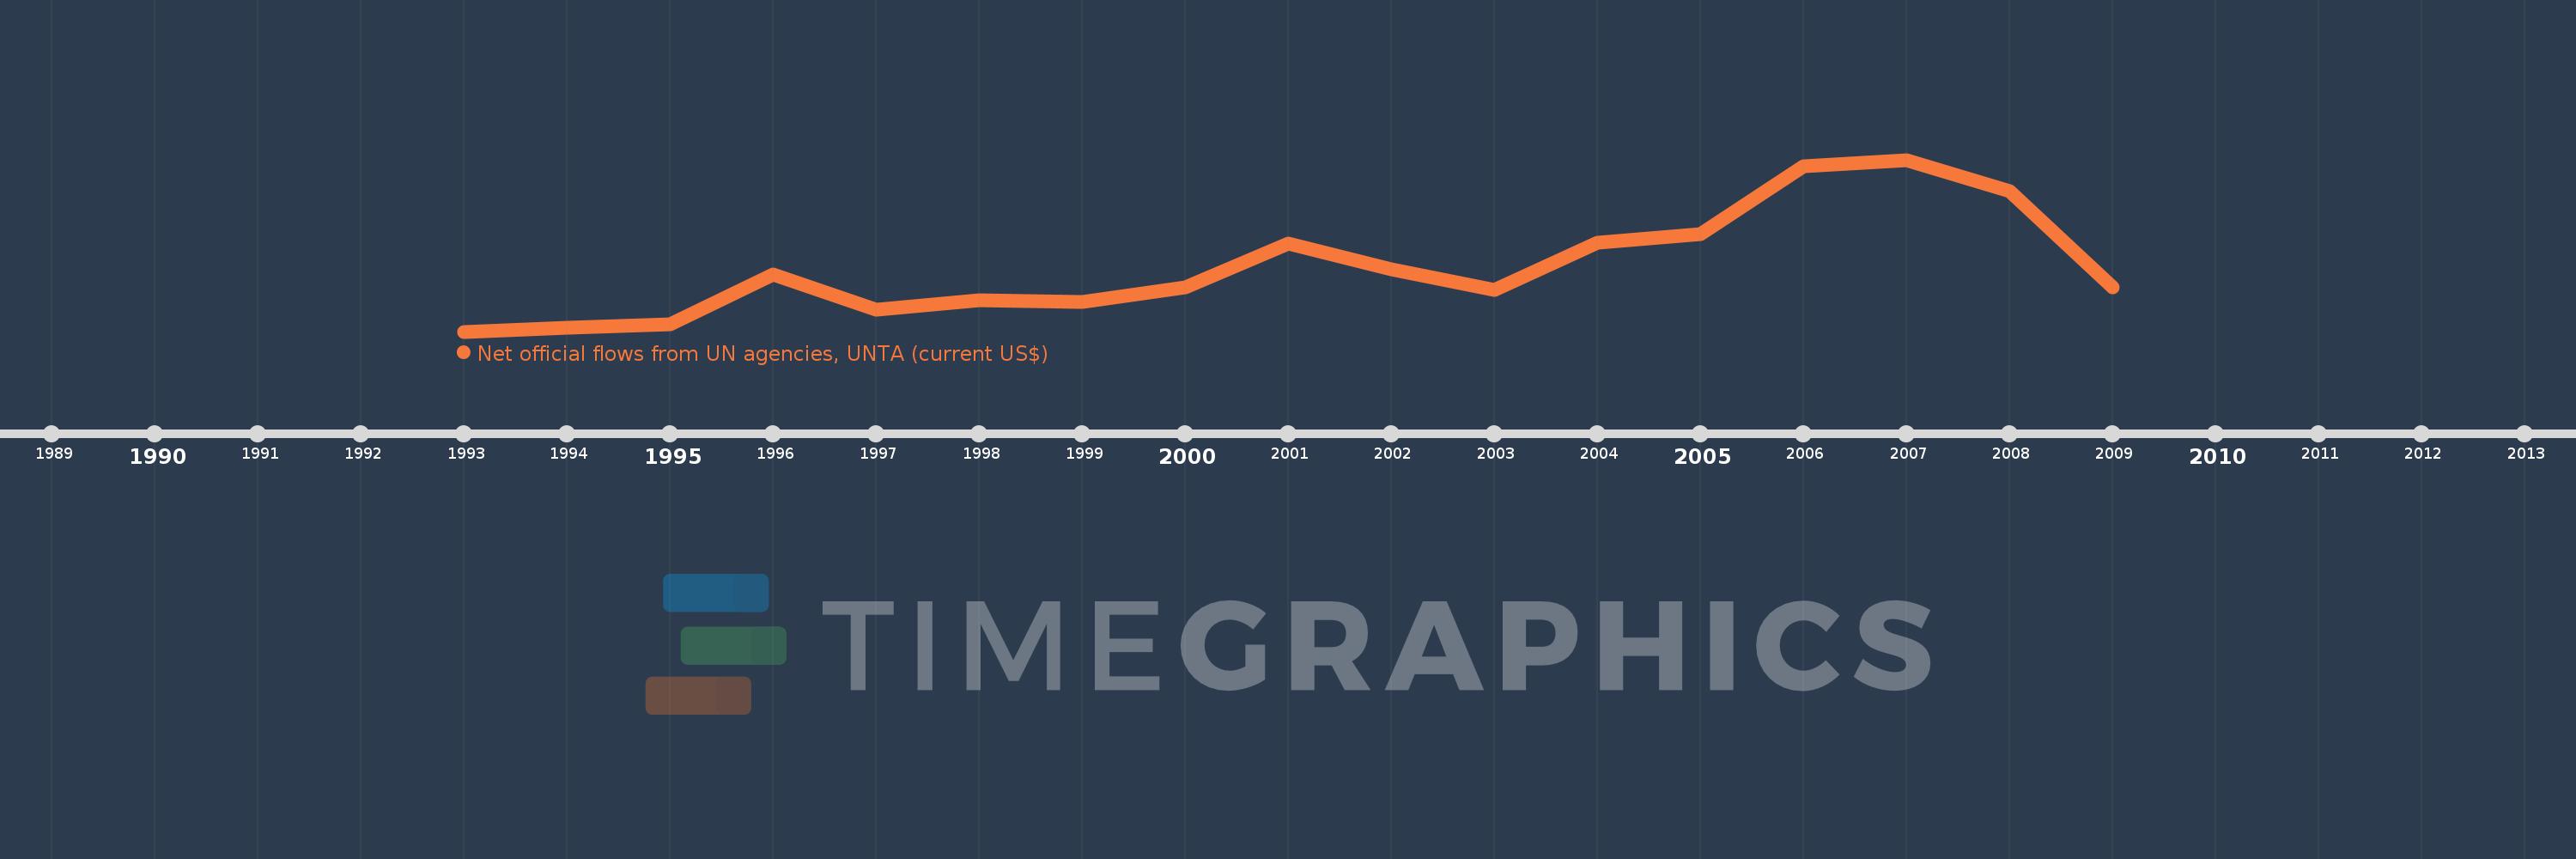
This timeline shows a graph from 1993 to 2009 of Uzbekistan. No data until 1992. Number of actual observations by date: 17.
Source name:
World Development Indicators
Source organization:
Development Assistance Committee of the Organisation for Economic Co-operation and Development, Geographical Distribution of Financial Flows to Developing Countries, Development Co-operation Report, and International Development Statistics database. Data are available online at: www.oecd.org/dac/stats/idsonline.
Categories, topics:
Aid Effectiveness
Last updated:
apr 23, 2017
Indicators value changes by year
Meaning:
538.235K
Minimum:
10.0K
jan 1, 1993
Maximum:
1.42 mln
jan 1, 2007
At the date of observation
Value
Absolute change
Change from the previous value
jan 1, 1993
10.0K
+10.0K
0.0%
jan 1, 1994
40.0K
+30.0K
300.0%
jan 1, 1995
70.0K
+30.0K
75.0%
jan 1, 1996
480.0K
+410.0K
585.71%
jan 1, 1997
190.0K
-290.0K
-60.42%
jan 1, 1998
270.0K
+80.0K
42.11%
jan 1, 1999
250.0K
-20.0K
-7.41%
jan 1, 2000
370.0K
+120.0K
48.0%
jan 1, 2001
730.0K
+360.0K
97.3%
jan 1, 2002
520.0K
-210.0K
-28.77%
jan 1, 2003
350.0K
-170.0K
-32.69%
jan 1, 2004
740.0K
+390.0K
111.43%
jan 1, 2005
810.0K
+70.0K
9.46%
jan 1, 2006
1.37 mln
+560.0K
69.14%
jan 1, 2007
1.42 mln
+50.0K
3.65%
jan 1, 2008
1.16 mln
-260.0K
-18.31%
jan 1, 2009
370.0K
-790.0K
-68.1%
Ranking of countries by current statistics by years