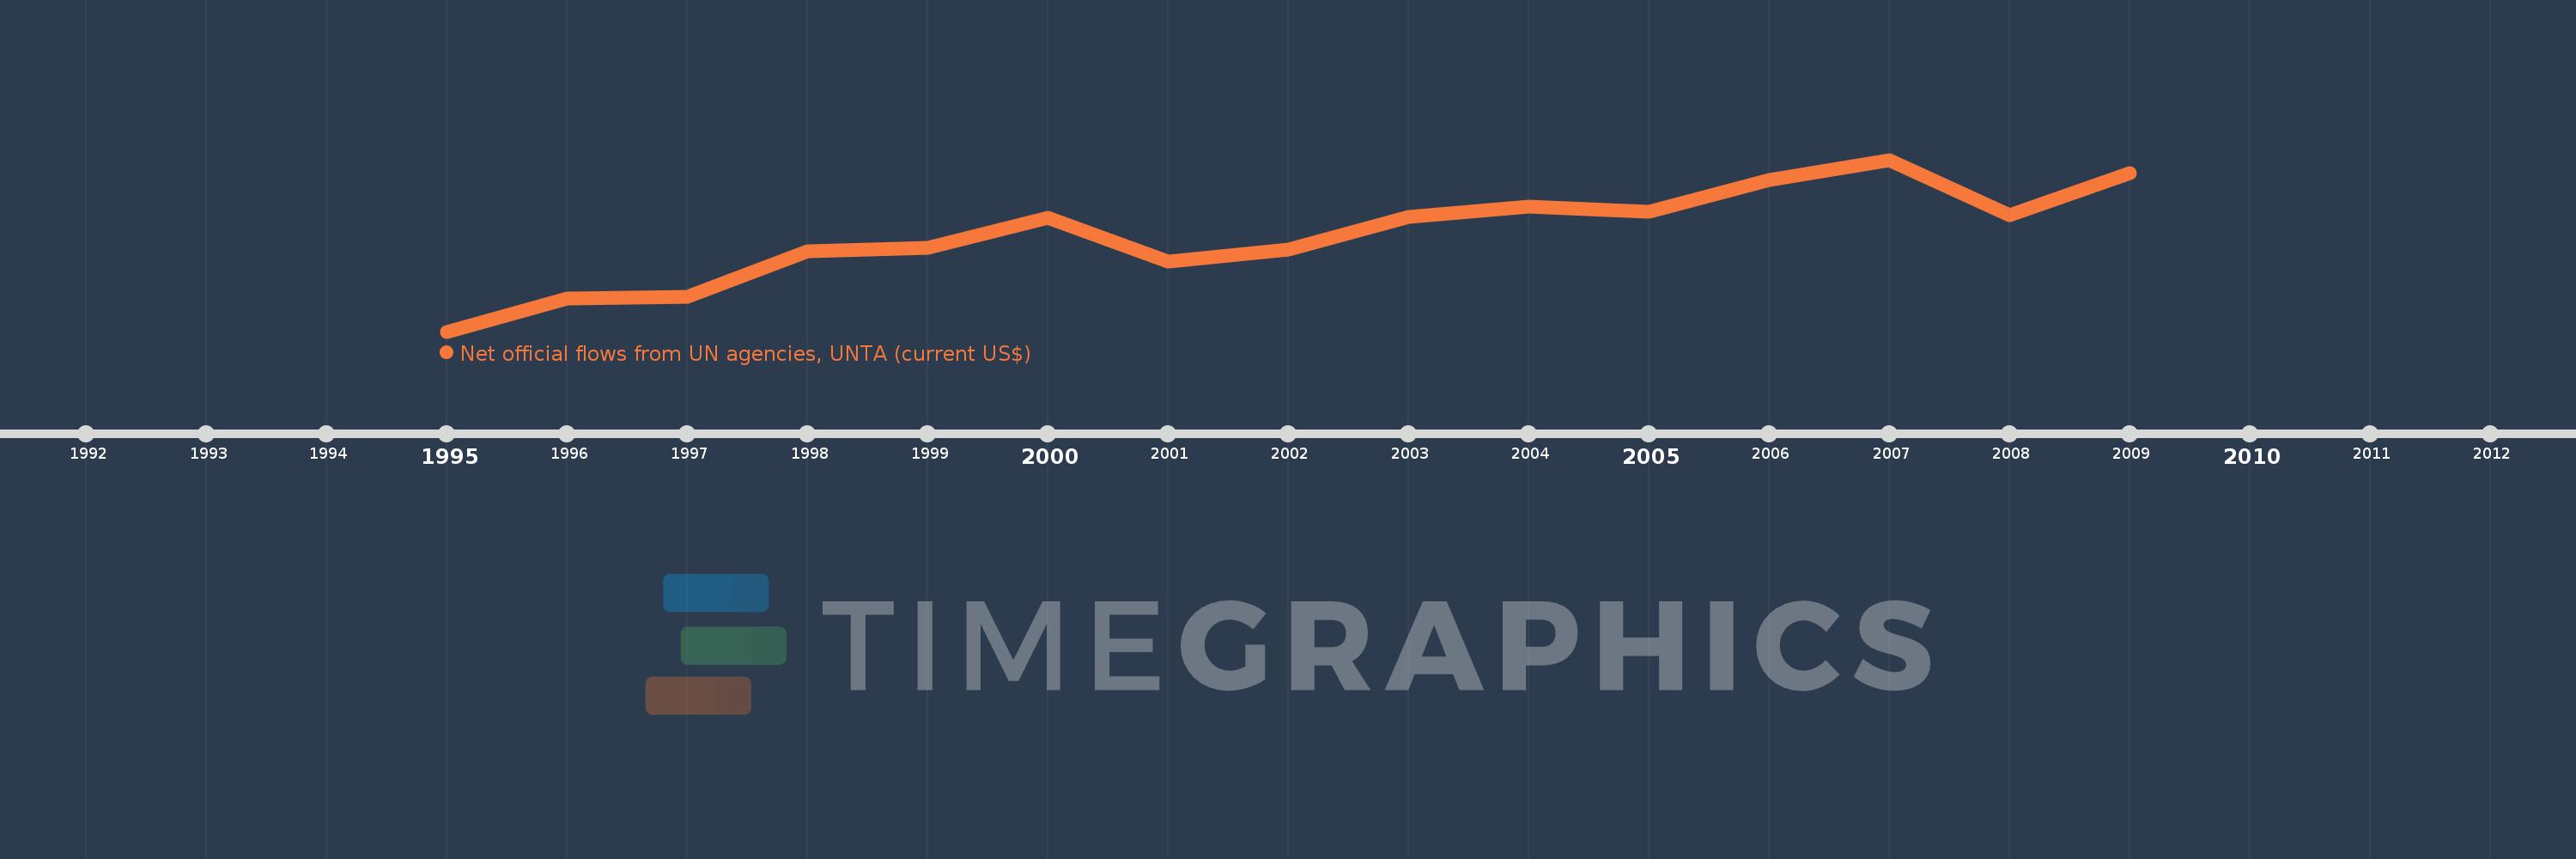
This timeline shows a graph from 1995 to 2009 of Macedonia, FYR. No data until 1994. Number of actual observations by date: 15.
Source name:
World Development Indicators
Source organization:
Development Assistance Committee of the Organisation for Economic Co-operation and Development, Geographical Distribution of Financial Flows to Developing Countries, Development Co-operation Report, and International Development Statistics database. Data are available online at: www.oecd.org/dac/stats/idsonline.
Categories, topics:
Aid Effectiveness
Last updated:
apr 23, 2017
Indicators value changes by year
Meaning:
592.0K
Minimum:
10.0K
jan 1, 1995
Maximum:
1.04 mln
jan 1, 2007
At the date of observation
Value
Absolute change
Change from the previous value
jan 1, 1995
10.0K
+10.0K
0.0%
jan 1, 1996
210.0K
+200.0K
2.0K%
jan 1, 1997
220.0K
+10.0K
4.76%
jan 1, 1998
490.0K
+270.0K
122.73%
jan 1, 1999
510.0K
+20.0K
4.08%
jan 1, 2000
690.0K
+180.0K
35.29%
jan 1, 2001
430.0K
-260.0K
-37.68%
jan 1, 2002
500.0K
+70.0K
16.28%
jan 1, 2003
700.0K
+200.0K
40.0%
jan 1, 2004
760.0K
+60.0K
8.57%
jan 1, 2005
730.0K
-30.0K
-3.95%
jan 1, 2006
920.0K
+190.0K
26.03%
jan 1, 2007
1.04 mln
+120.0K
13.04%
jan 1, 2008
710.0K
-330.0K
-31.73%
jan 1, 2009
960.0K
+250.0K
35.21%
Ranking of countries by current statistics by years