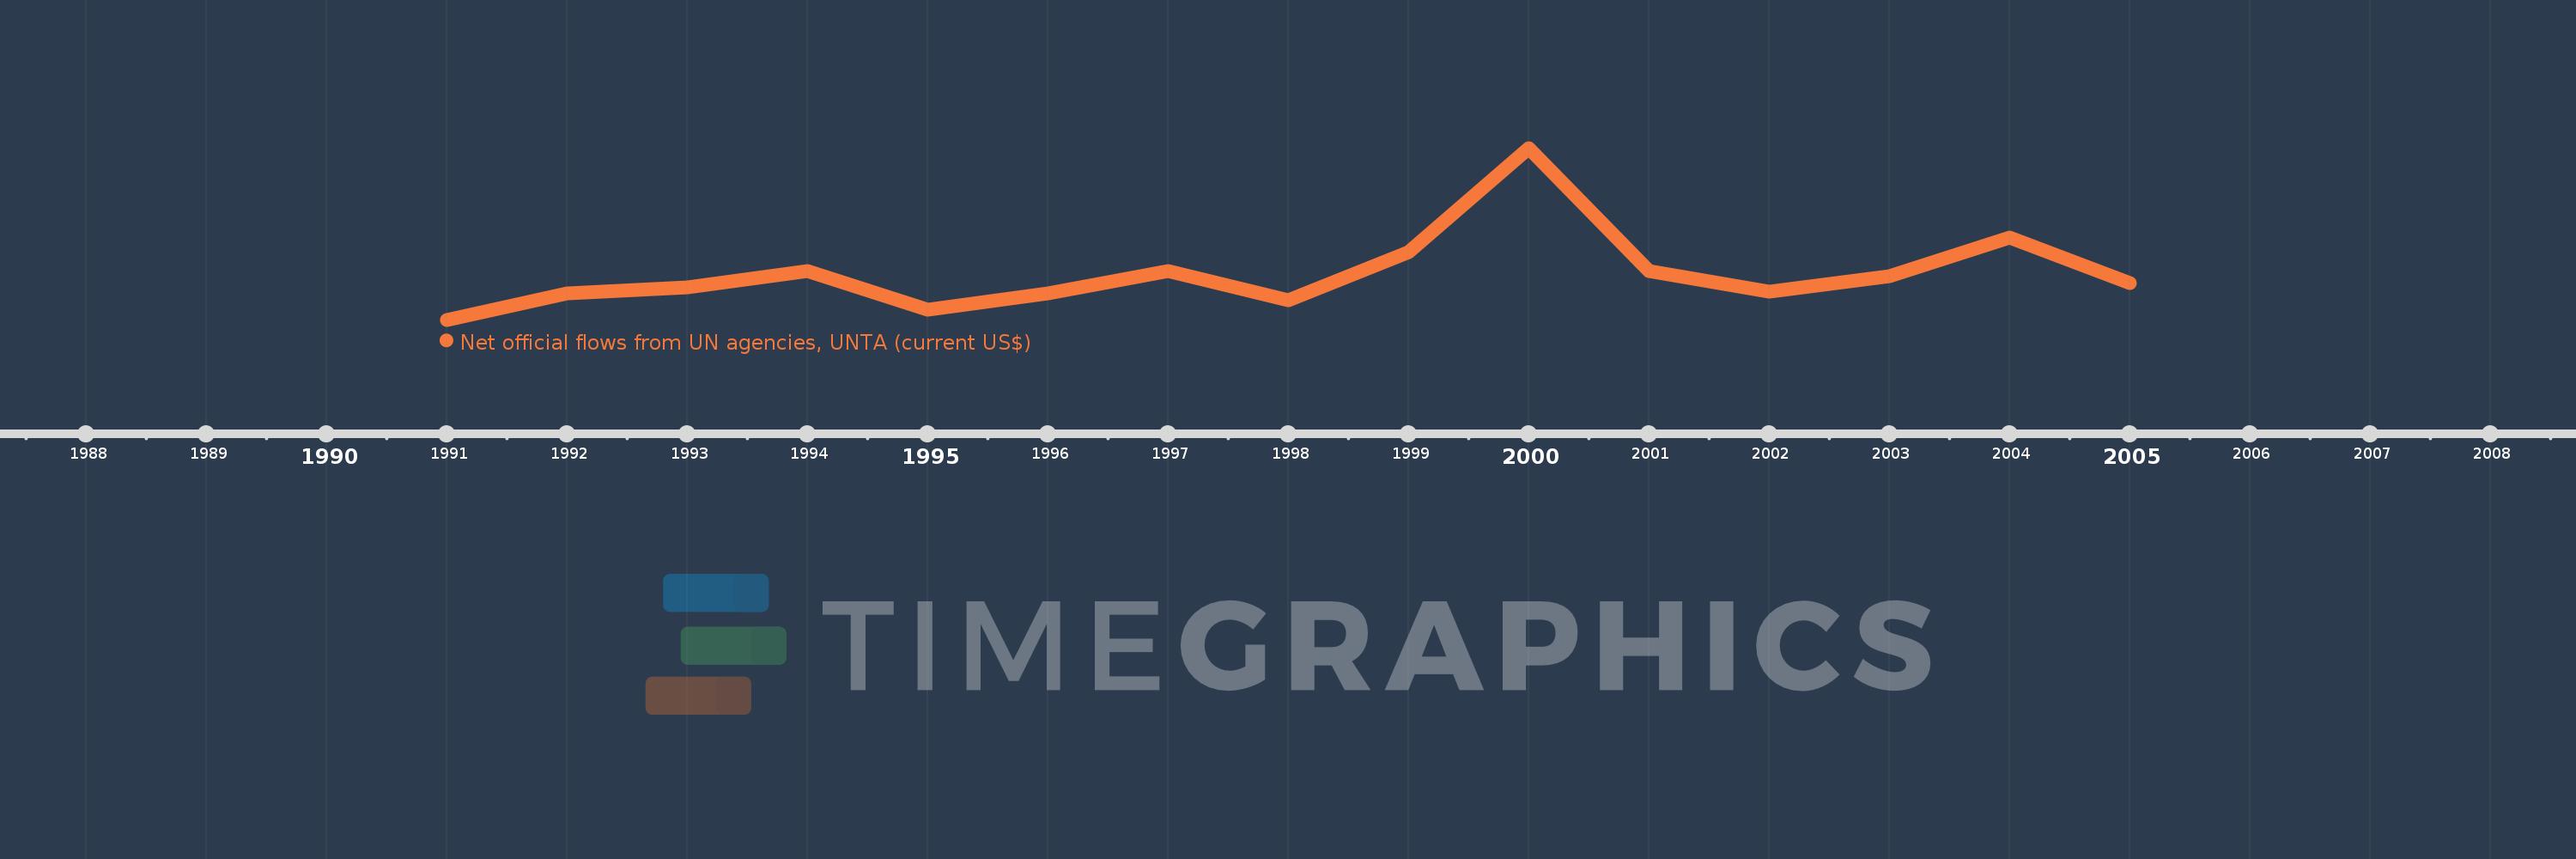
This timeline shows a graph from 1991 to 2005 of Czech Republic. No data until 1990. Number of actual observations by date: 15.
Source name:
World Development Indicators
Source organization:
Development Assistance Committee of the Organisation for Economic Co-operation and Development, Geographical Distribution of Financial Flows to Developing Countries, Development Co-operation Report, and International Development Statistics database. Data are available online at: www.oecd.org/dac/stats/idsonline.
Categories, topics:
Aid Effectiveness
Last updated:
apr 23, 2017
Indicators value changes by year
Meaning:
460.0K
Minimum:
80.0K
jan 1, 1991
Maximum:
1.5 mln
jan 1, 2000
At the date of observation
Value
Absolute change
Change from the previous value
jan 1, 1991
80.0K
+80.0K
0.0%
jan 1, 1992
300.0K
+220.0K
275.0%
jan 1, 1993
350.0K
+50.0K
16.67%
jan 1, 1994
480.0K
+130.0K
37.14%
jan 1, 1995
160.0K
-320.0K
-66.67%
jan 1, 1996
300.0K
+140.0K
87.5%
jan 1, 1997
480.0K
+180.0K
60.0%
jan 1, 1998
240.0K
-240.0K
-50.0%
jan 1, 1999
640.0K
+400.0K
166.67%
jan 1, 2000
1.5 mln
+860.0K
134.38%
jan 1, 2001
480.0K
-1.02 mln
-68.0%
jan 1, 2002
310.0K
-170.0K
-35.42%
jan 1, 2003
440.0K
+130.0K
41.94%
jan 1, 2004
760.0K
+320.0K
72.73%
jan 1, 2005
380.0K
-380.0K
-50.0%
Ranking of countries by current statistics by years