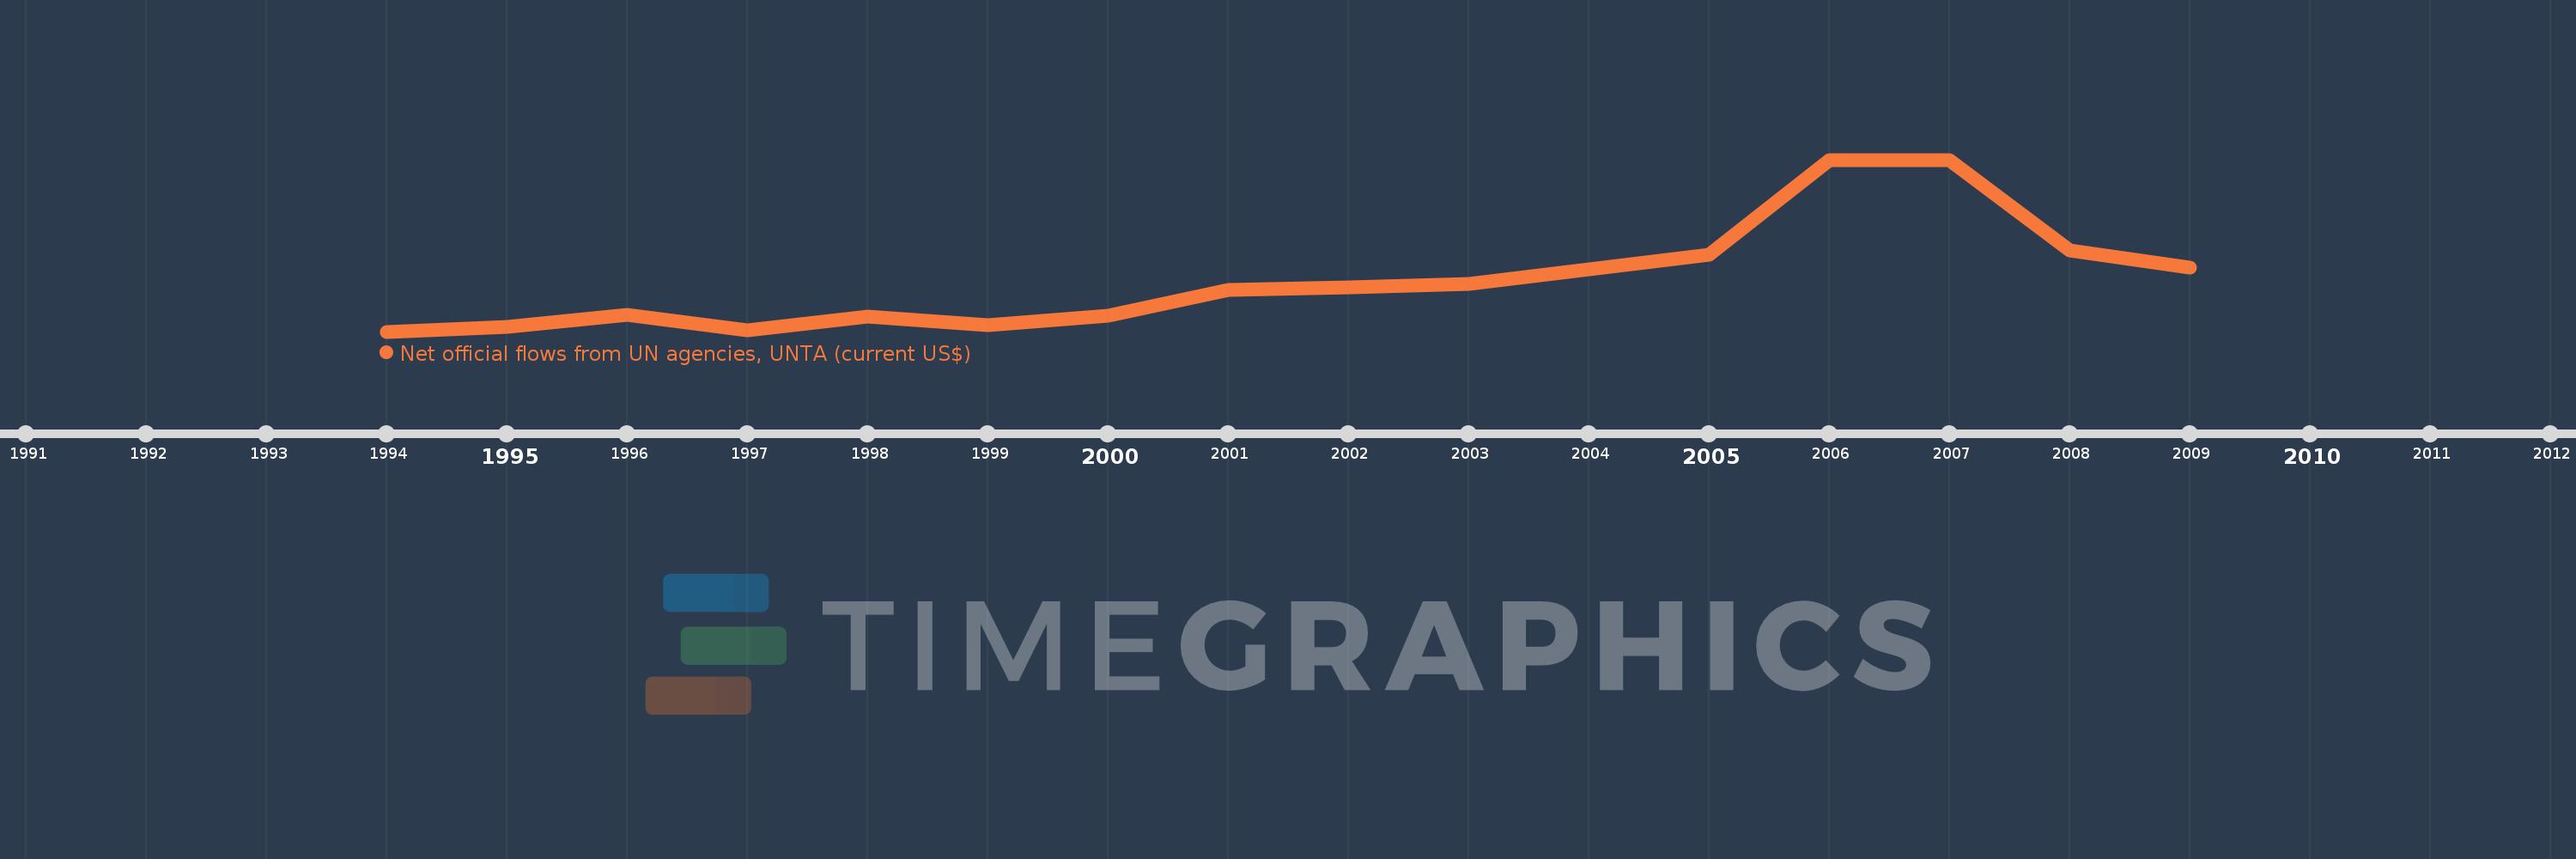
This timeline shows a graph from 1994 to 2009 of Azerbaijan. No data until 1993. Number of actual observations by date: 16.
Source name:
World Development Indicators
Source organization:
Development Assistance Committee of the Organisation for Economic Co-operation and Development, Geographical Distribution of Financial Flows to Developing Countries, Development Co-operation Report, and International Development Statistics database. Data are available online at: www.oecd.org/dac/stats/idsonline.
Categories, topics:
Aid Effectiveness
Last updated:
apr 23, 2017
Indicators value changes by year
Meaning:
448.75K
Minimum:
30.0K
jan 1, 1994
Maximum:
1.43 mln
jan 1, 2006
At the date of observation
Value
Absolute change
Change from the previous value
jan 1, 1994
30.0K
+30.0K
0.0%
jan 1, 1995
70.0K
+40.0K
133.33%
jan 1, 1996
170.0K
+100.0K
142.86%
jan 1, 1997
40.0K
-130.0K
-76.47%
jan 1, 1998
150.0K
+110.0K
275.0%
jan 1, 1999
80.0K
-70.0K
-46.67%
jan 1, 2000
160.0K
+80.0K
100.0%
jan 1, 2001
370.0K
+210.0K
131.25%
jan 1, 2002
390.0K
+20.0K
5.41%
jan 1, 2003
420.0K
+30.0K
7.69%
jan 1, 2004
540.0K
+120.0K
28.57%
jan 1, 2005
660.0K
+120.0K
22.22%
jan 1, 2006
1.43 mln
+770.0K
116.67%
jan 1, 2007
1.43 mln
0.0
0.0%
jan 1, 2008
690.0K
-740.0K
-51.75%
jan 1, 2009
550.0K
-140.0K
-20.29%
Ranking of countries by current statistics by years