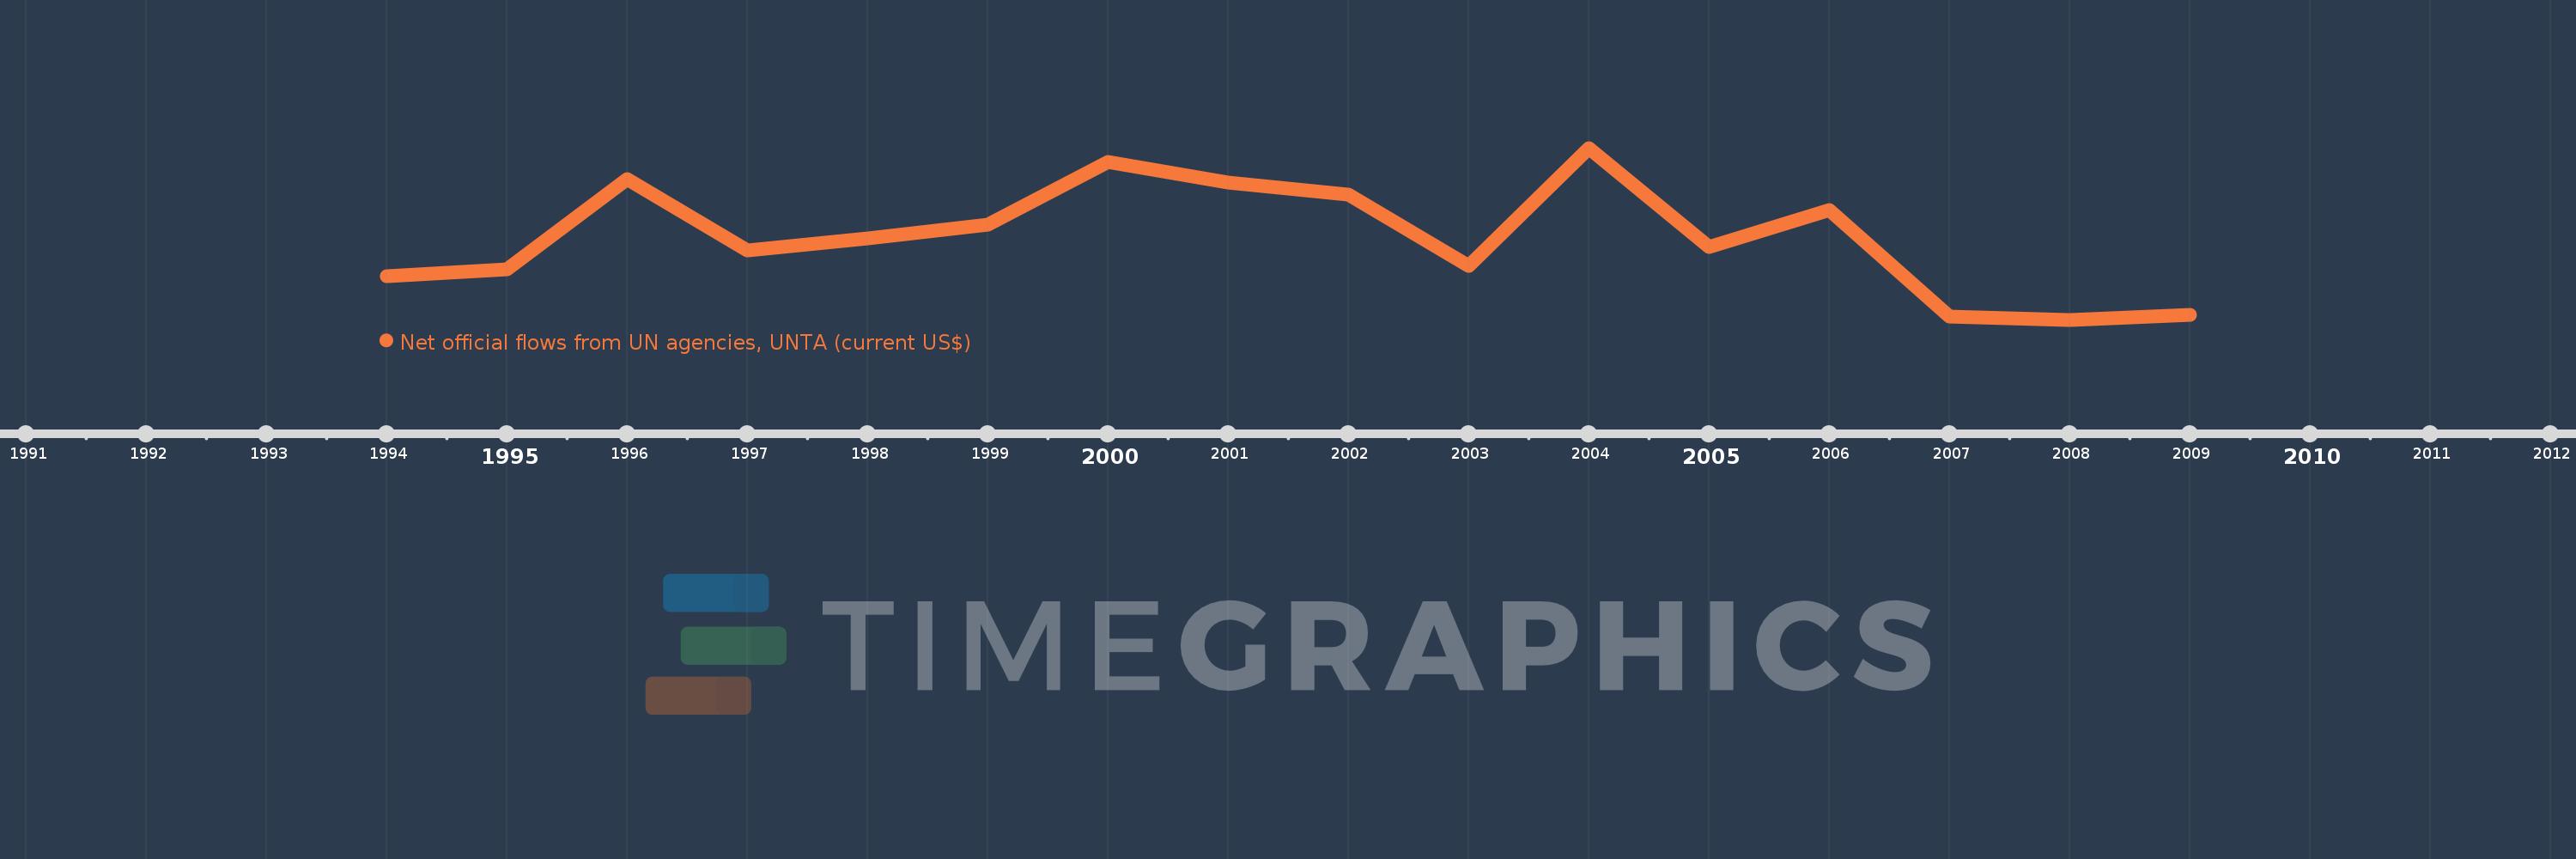
This timeline shows a graph from 1994 to 2009 of West Bank and Gaza. No data until 1993. Number of actual observations by date: 16.
Source name:
World Development Indicators
Source organization:
Development Assistance Committee of the Organisation for Economic Co-operation and Development, Geographical Distribution of Financial Flows to Developing Countries, Development Co-operation Report, and International Development Statistics database. Data are available online at: www.oecd.org/dac/stats/idsonline.
Categories, topics:
Aid Effectiveness
Last updated:
apr 23, 2017
Indicators value changes by year
Meaning:
514.375K
Minimum:
40.0K
jan 1, 2008
Maximum:
1.03 mln
jan 1, 2004
At the date of observation
Value
Absolute change
Change from the previous value
jan 1, 1994
290.0K
+290.0K
0.0%
jan 1, 1995
330.0K
+40.0K
13.79%
jan 1, 1996
850.0K
+520.0K
157.58%
jan 1, 1997
440.0K
-410.0K
-48.24%
jan 1, 1998
510.0K
+70.0K
15.91%
jan 1, 1999
590.0K
+80.0K
15.69%
jan 1, 2000
950.0K
+360.0K
61.02%
jan 1, 2001
830.0K
-120.0K
-12.63%
jan 1, 2002
760.0K
-70.0K
-8.43%
jan 1, 2003
350.0K
-410.0K
-53.95%
jan 1, 2004
1.03 mln
+680.0K
194.29%
jan 1, 2005
460.0K
-570.0K
-55.34%
jan 1, 2006
670.0K
+210.0K
45.65%
jan 1, 2007
60.0K
-610.0K
-91.04%
jan 1, 2008
40.0K
-20.0K
-33.33%
jan 1, 2009
70.0K
+30.0K
75.0%
Ranking of countries by current statistics by years