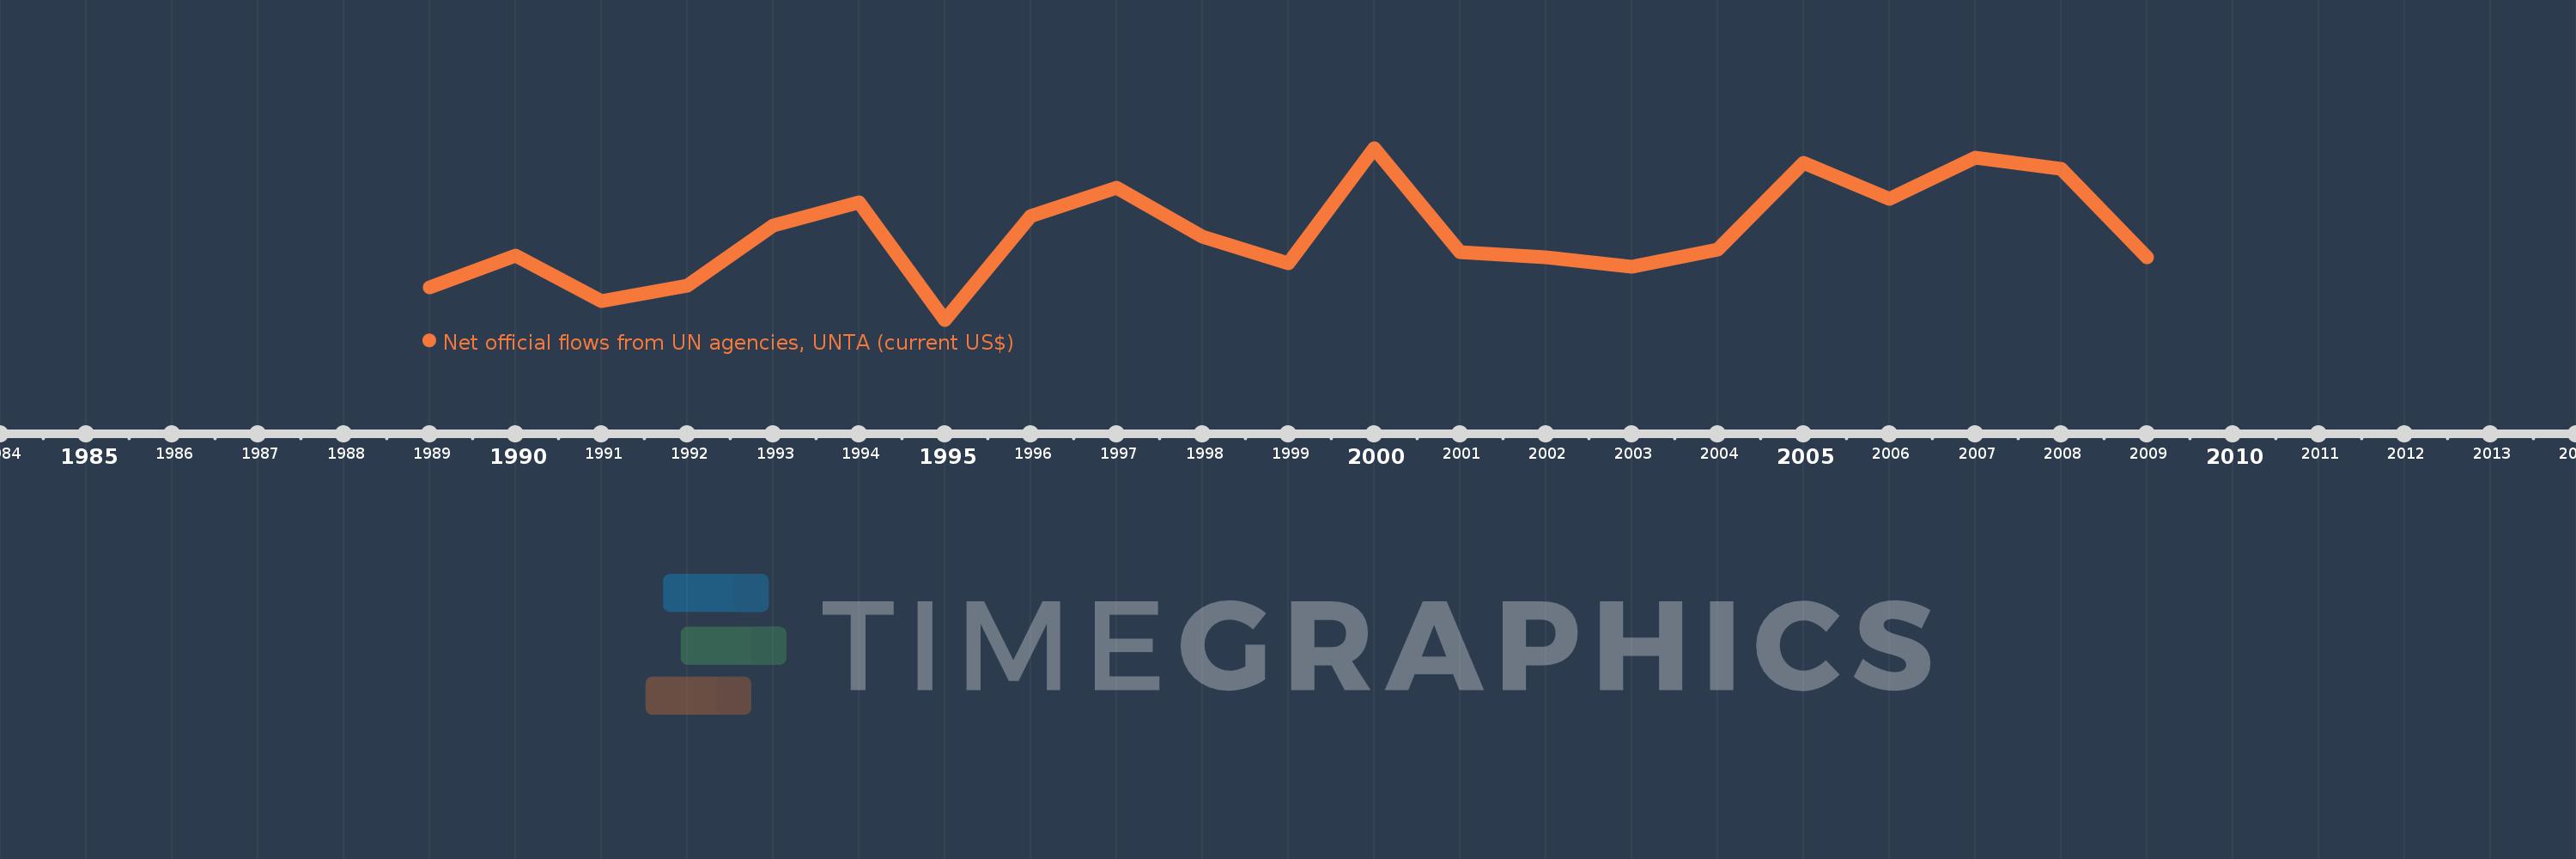
This timeline shows a graph from 1989 to 2009 of Albania. No data until 1988. Number of actual observations by date: 21.
Source name:
World Development Indicators
Source organization:
Development Assistance Committee of the Organisation for Economic Co-operation and Development, Geographical Distribution of Financial Flows to Developing Countries, Development Co-operation Report, and International Development Statistics database. Data are available online at: www.oecd.org/dac/stats/idsonline.
Categories, topics:
Aid Effectiveness
Last updated:
apr 23, 2017
Indicators value changes by year
Meaning:
547.619K
Minimum:
90.0K
jan 1, 1995
Maximum:
1000.0K
jan 1, 2000
At the date of observation
Value
Absolute change
Change from the previous value
jan 1, 1989
260.0K
+260.0K
0.0%
jan 1, 1990
430.0K
+170.0K
65.38%
jan 1, 1991
190.0K
-240.0K
-55.81%
jan 1, 1992
270.0K
+80.0K
42.11%
jan 1, 1993
590.0K
+320.0K
118.52%
jan 1, 1994
710.0K
+120.0K
20.34%
jan 1, 1995
90.0K
-620.0K
-87.32%
jan 1, 1996
640.0K
+550.0K
611.11%
jan 1, 1997
790.0K
+150.0K
23.44%
jan 1, 1998
530.0K
-260.0K
-32.91%
jan 1, 1999
390.0K
-140.0K
-26.42%
jan 1, 2000
1000.0K
+610.0K
156.41%
jan 1, 2001
450.0K
-550.0K
-55.0%
jan 1, 2002
420.0K
-30.0K
-6.67%
jan 1, 2003
370.0K
-50.0K
-11.9%
jan 1, 2004
460.0K
+90.0K
24.32%
jan 1, 2005
920.0K
+460.0K
100.0%
jan 1, 2006
730.0K
-190.0K
-20.65%
jan 1, 2007
950.0K
+220.0K
30.14%
jan 1, 2008
890.0K
-60.0K
-6.32%
jan 1, 2009
420.0K
-470.0K
-52.81%
Ranking of countries by current statistics by years