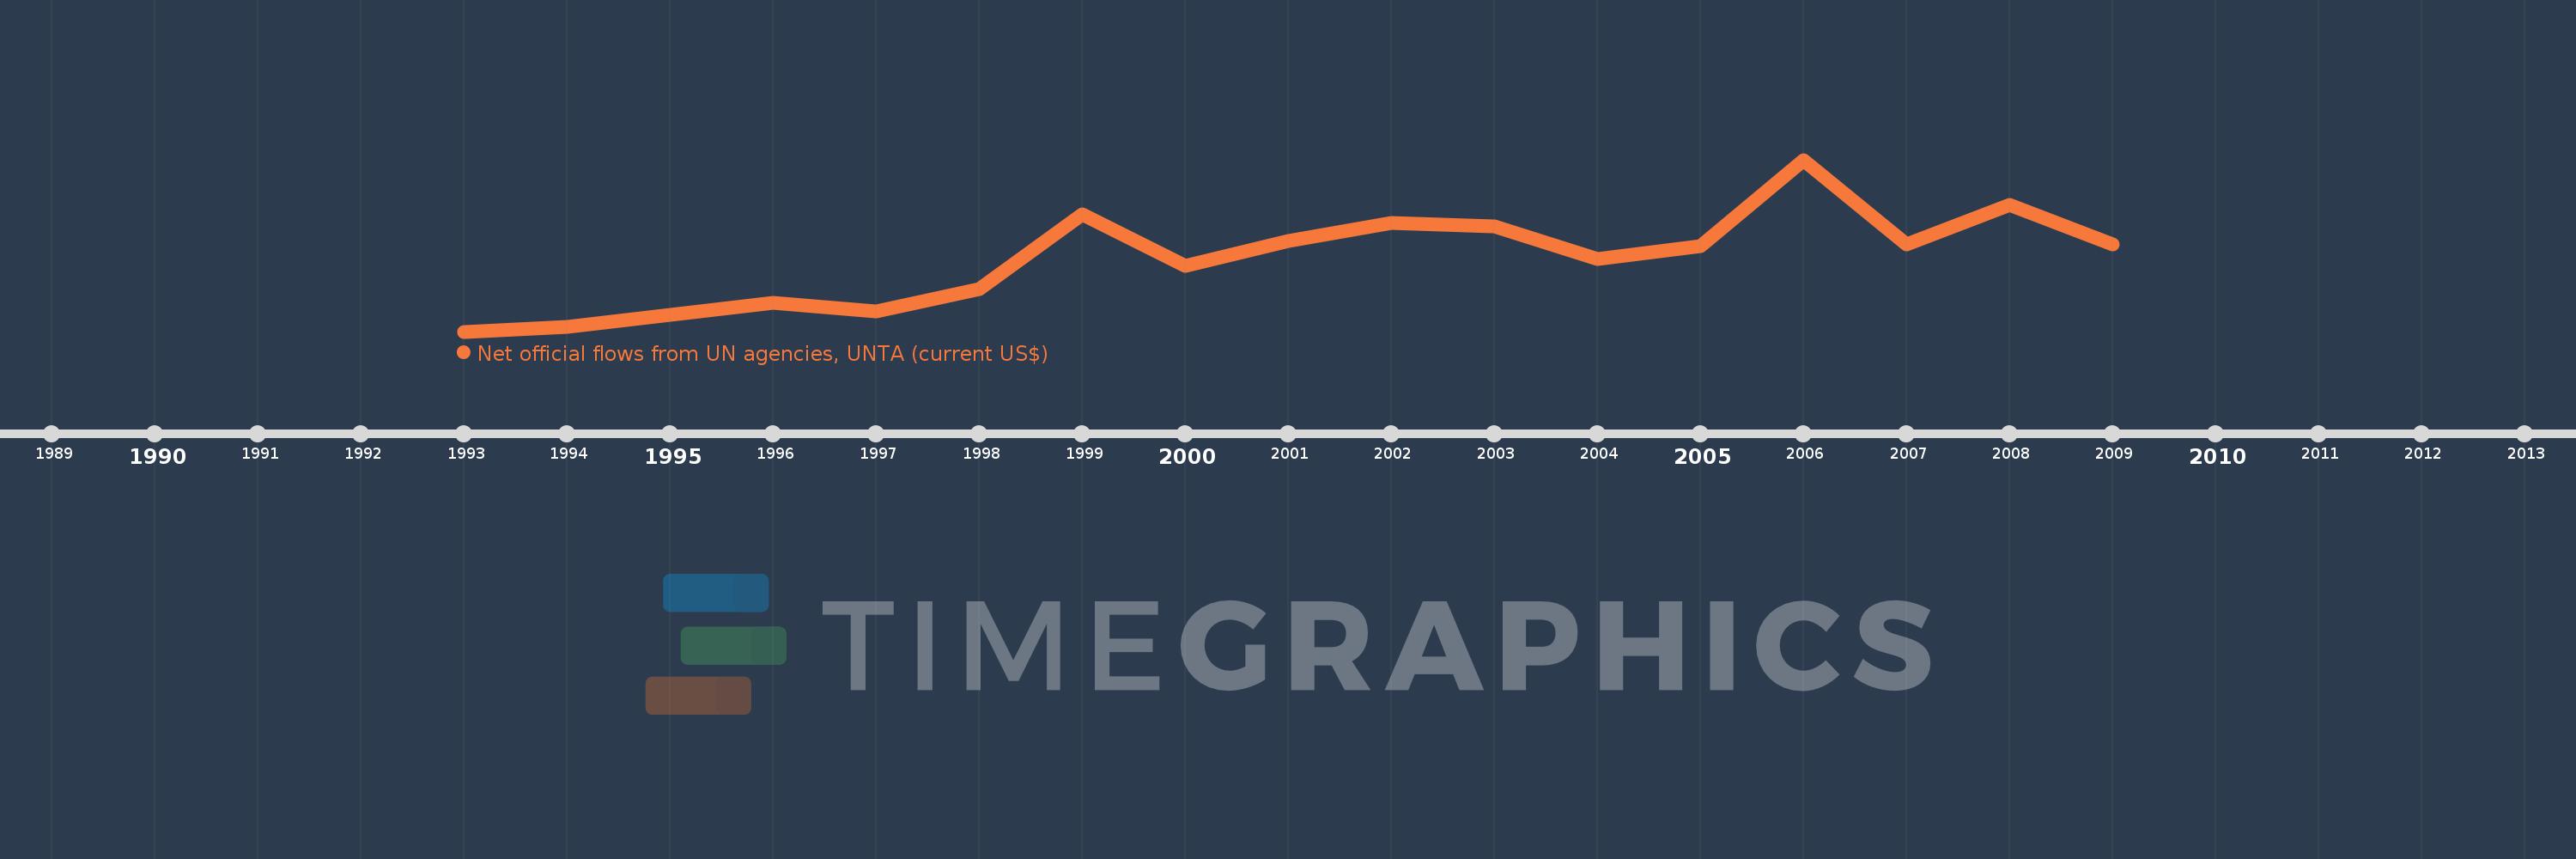
This timeline shows a graph from 1993 to 2009 of Georgia. No data until 1992. Number of actual observations by date: 17.
Source name:
World Development Indicators
Source organization:
Development Assistance Committee of the Organisation for Economic Co-operation and Development, Geographical Distribution of Financial Flows to Developing Countries, Development Co-operation Report, and International Development Statistics database. Data are available online at: www.oecd.org/dac/stats/idsonline.
Categories, topics:
Aid Effectiveness
Last updated:
apr 23, 2017
Indicators value changes by year
Meaning:
629.412K
Minimum:
30.0K
jan 1, 1993
Maximum:
1.45 mln
jan 1, 2006
At the date of observation
Value
Absolute change
Change from the previous value
jan 1, 1993
30.0K
+30.0K
0.0%
jan 1, 1994
70.0K
+40.0K
133.33%
jan 1, 1995
170.0K
+100.0K
142.86%
jan 1, 1996
270.0K
+100.0K
58.82%
jan 1, 1997
200.0K
-70.0K
-25.93%
jan 1, 1998
380.0K
+180.0K
90.0%
jan 1, 1999
1000.0K
+620.0K
163.16%
jan 1, 2000
570.0K
-430.0K
-43.0%
jan 1, 2001
780.0K
+210.0K
36.84%
jan 1, 2002
930.0K
+150.0K
19.23%
jan 1, 2003
900.0K
-30.0K
-3.23%
jan 1, 2004
630.0K
-270.0K
-30.0%
jan 1, 2005
740.0K
+110.0K
17.46%
jan 1, 2006
1.45 mln
+710.0K
95.95%
jan 1, 2007
750.0K
-700.0K
-48.28%
jan 1, 2008
1.08 mln
+330.0K
44.0%
jan 1, 2009
750.0K
-330.0K
-30.56%
Ranking of countries by current statistics by years