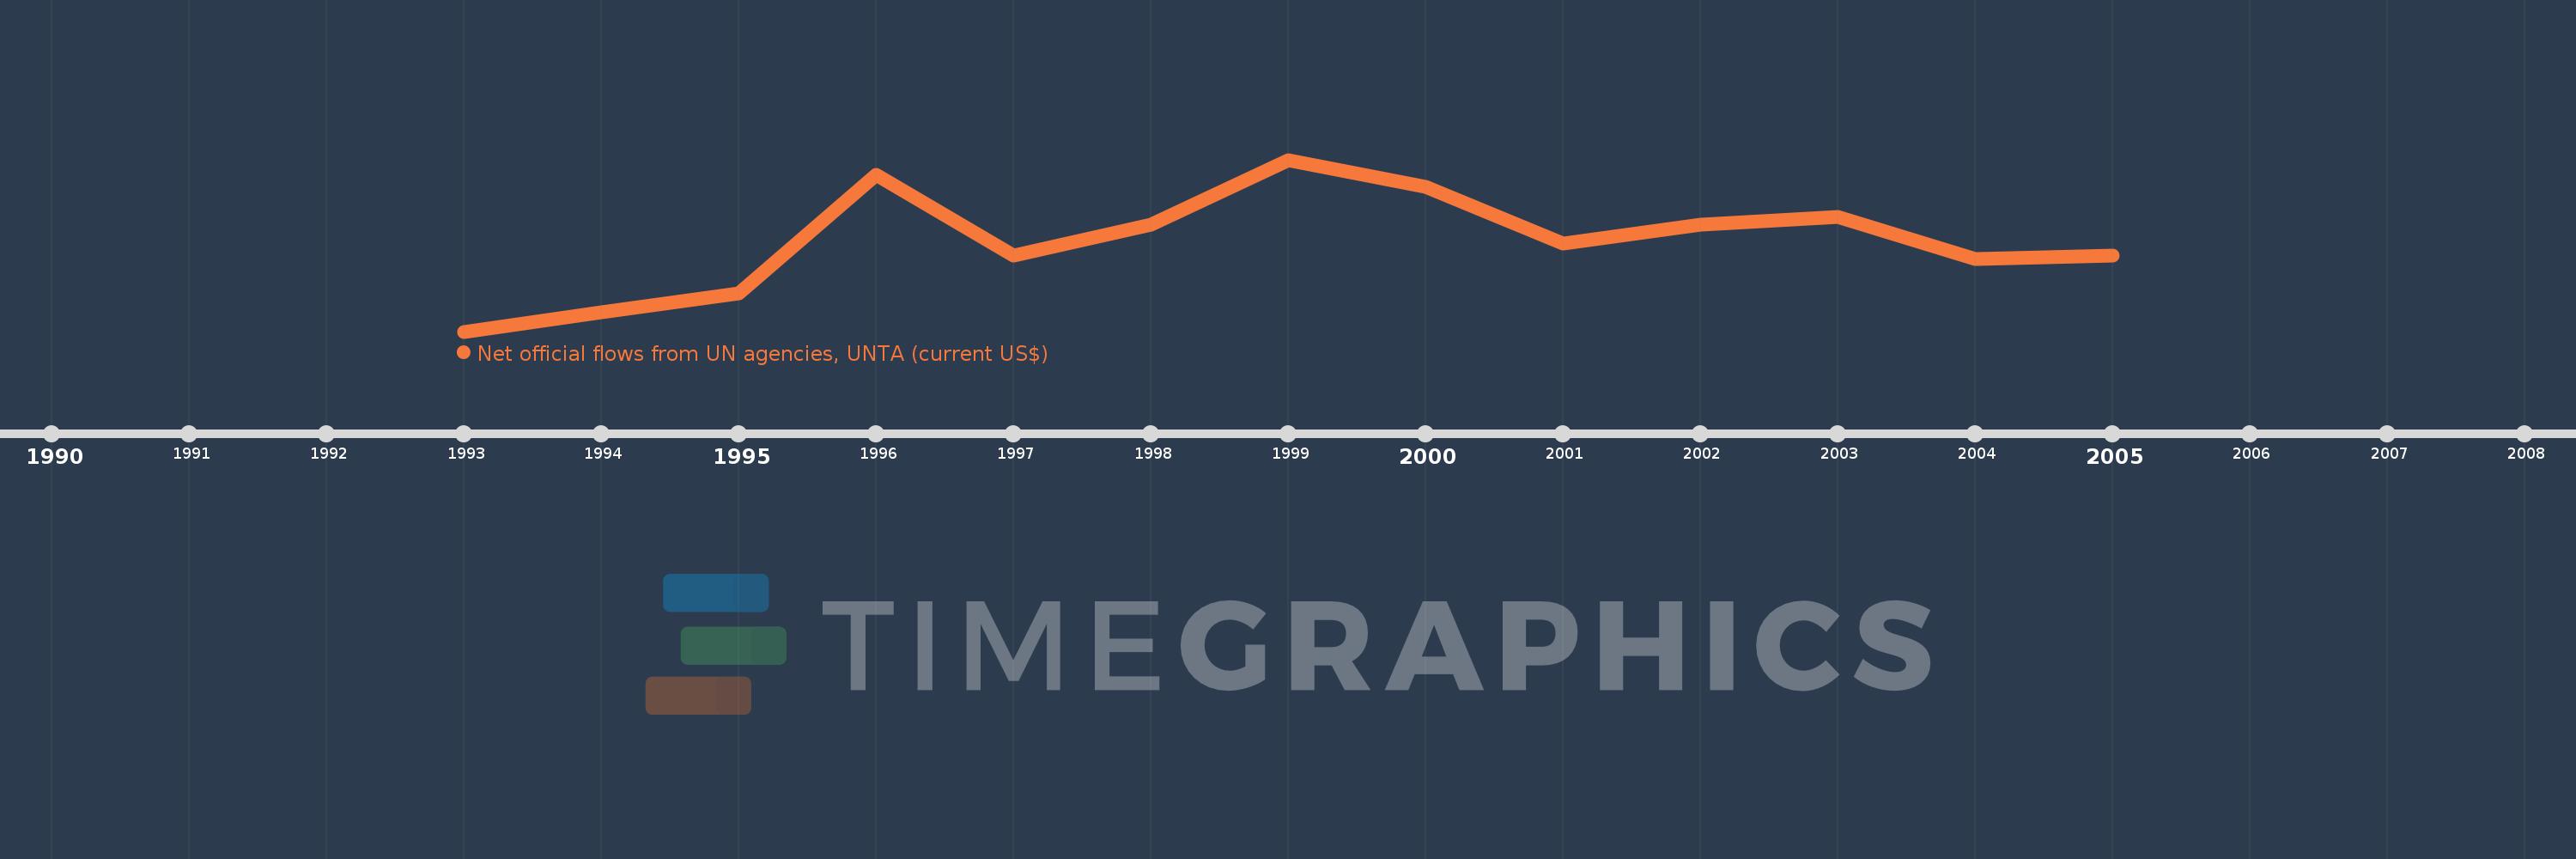
This timeline shows a graph from 1993 to 2005 of Lithuania. No data until 1992. Number of actual observations by date: 13.
Source name:
World Development Indicators
Source organization:
Development Assistance Committee of the Organisation for Economic Co-operation and Development, Geographical Distribution of Financial Flows to Developing Countries, Development Co-operation Report, and International Development Statistics database. Data are available online at: www.oecd.org/dac/stats/idsonline.
Categories, topics:
Aid Effectiveness
Last updated:
apr 23, 2017
Indicators value changes by year
Meaning:
366.154K
Minimum:
130.0K
jan 1, 1993
Maximum:
580.0K
jan 1, 1999
At the date of observation
Value
Absolute change
Change from the previous value
jan 1, 1993
130.0K
+130.0K
0.0%
jan 1, 1994
180.0K
+50.0K
38.46%
jan 1, 1995
230.0K
+50.0K
27.78%
jan 1, 1996
540.0K
+310.0K
134.78%
jan 1, 1997
330.0K
-210.0K
-38.89%
jan 1, 1998
410.0K
+80.0K
24.24%
jan 1, 1999
580.0K
+170.0K
41.46%
jan 1, 2000
510.0K
-70.0K
-12.07%
jan 1, 2001
360.0K
-150.0K
-29.41%
jan 1, 2002
410.0K
+50.0K
13.89%
jan 1, 2003
430.0K
+20.0K
4.88%
jan 1, 2004
320.0K
-110.0K
-25.58%
jan 1, 2005
330.0K
+10.0K
3.13%
Ranking of countries by current statistics by years