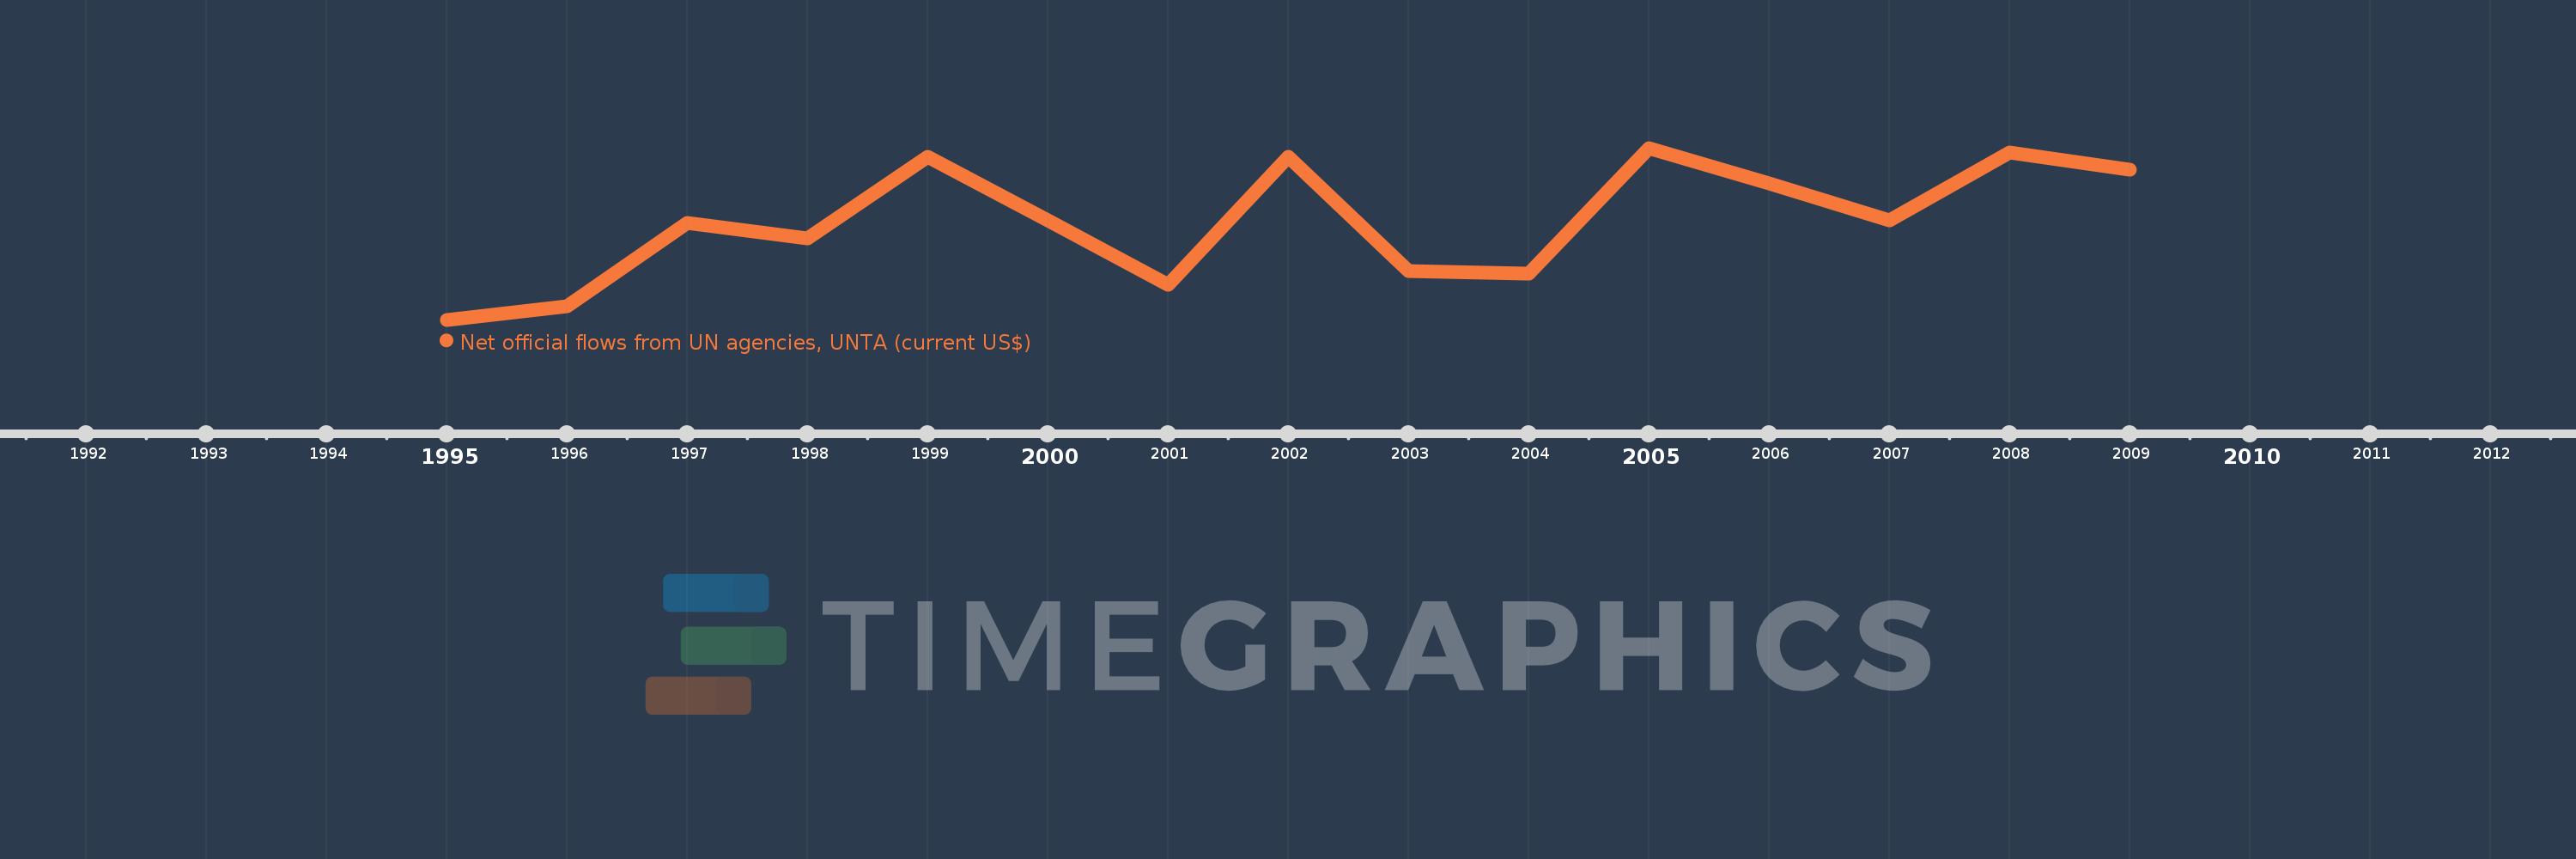
This timeline shows a graph from 1995 to 2009 of Bosnia and Herzegovina. No data until 1994. Number of actual observations by date: 15.
Source name:
World Development Indicators
Source organization:
Development Assistance Committee of the Organisation for Economic Co-operation and Development, Geographical Distribution of Financial Flows to Developing Countries, Development Co-operation Report, and International Development Statistics database. Data are available online at: www.oecd.org/dac/stats/idsonline.
Categories, topics:
Aid Effectiveness
Last updated:
apr 23, 2017
Indicators value changes by year
Meaning:
605.333K
Minimum:
160.0K
jan 1, 1995
Maximum:
940.0K
jan 1, 2005
At the date of observation
Value
Absolute change
Change from the previous value
jan 1, 1995
160.0K
+160.0K
0.0%
jan 1, 1996
220.0K
+60.0K
37.5%
jan 1, 1997
600.0K
+380.0K
172.73%
jan 1, 1998
530.0K
-70.0K
-11.67%
jan 1, 1999
900.0K
+370.0K
69.81%
jan 1, 2000
610.0K
-290.0K
-32.22%
jan 1, 2001
320.0K
-290.0K
-47.54%
jan 1, 2002
900.0K
+580.0K
181.25%
jan 1, 2003
380.0K
-520.0K
-57.78%
jan 1, 2004
370.0K
-10.0K
-2.63%
jan 1, 2005
940.0K
+570.0K
154.05%
jan 1, 2006
780.0K
-160.0K
-17.02%
jan 1, 2007
610.0K
-170.0K
-21.79%
jan 1, 2008
920.0K
+310.0K
50.82%
jan 1, 2009
840.0K
-80.0K
-8.7%
Ranking of countries by current statistics by years