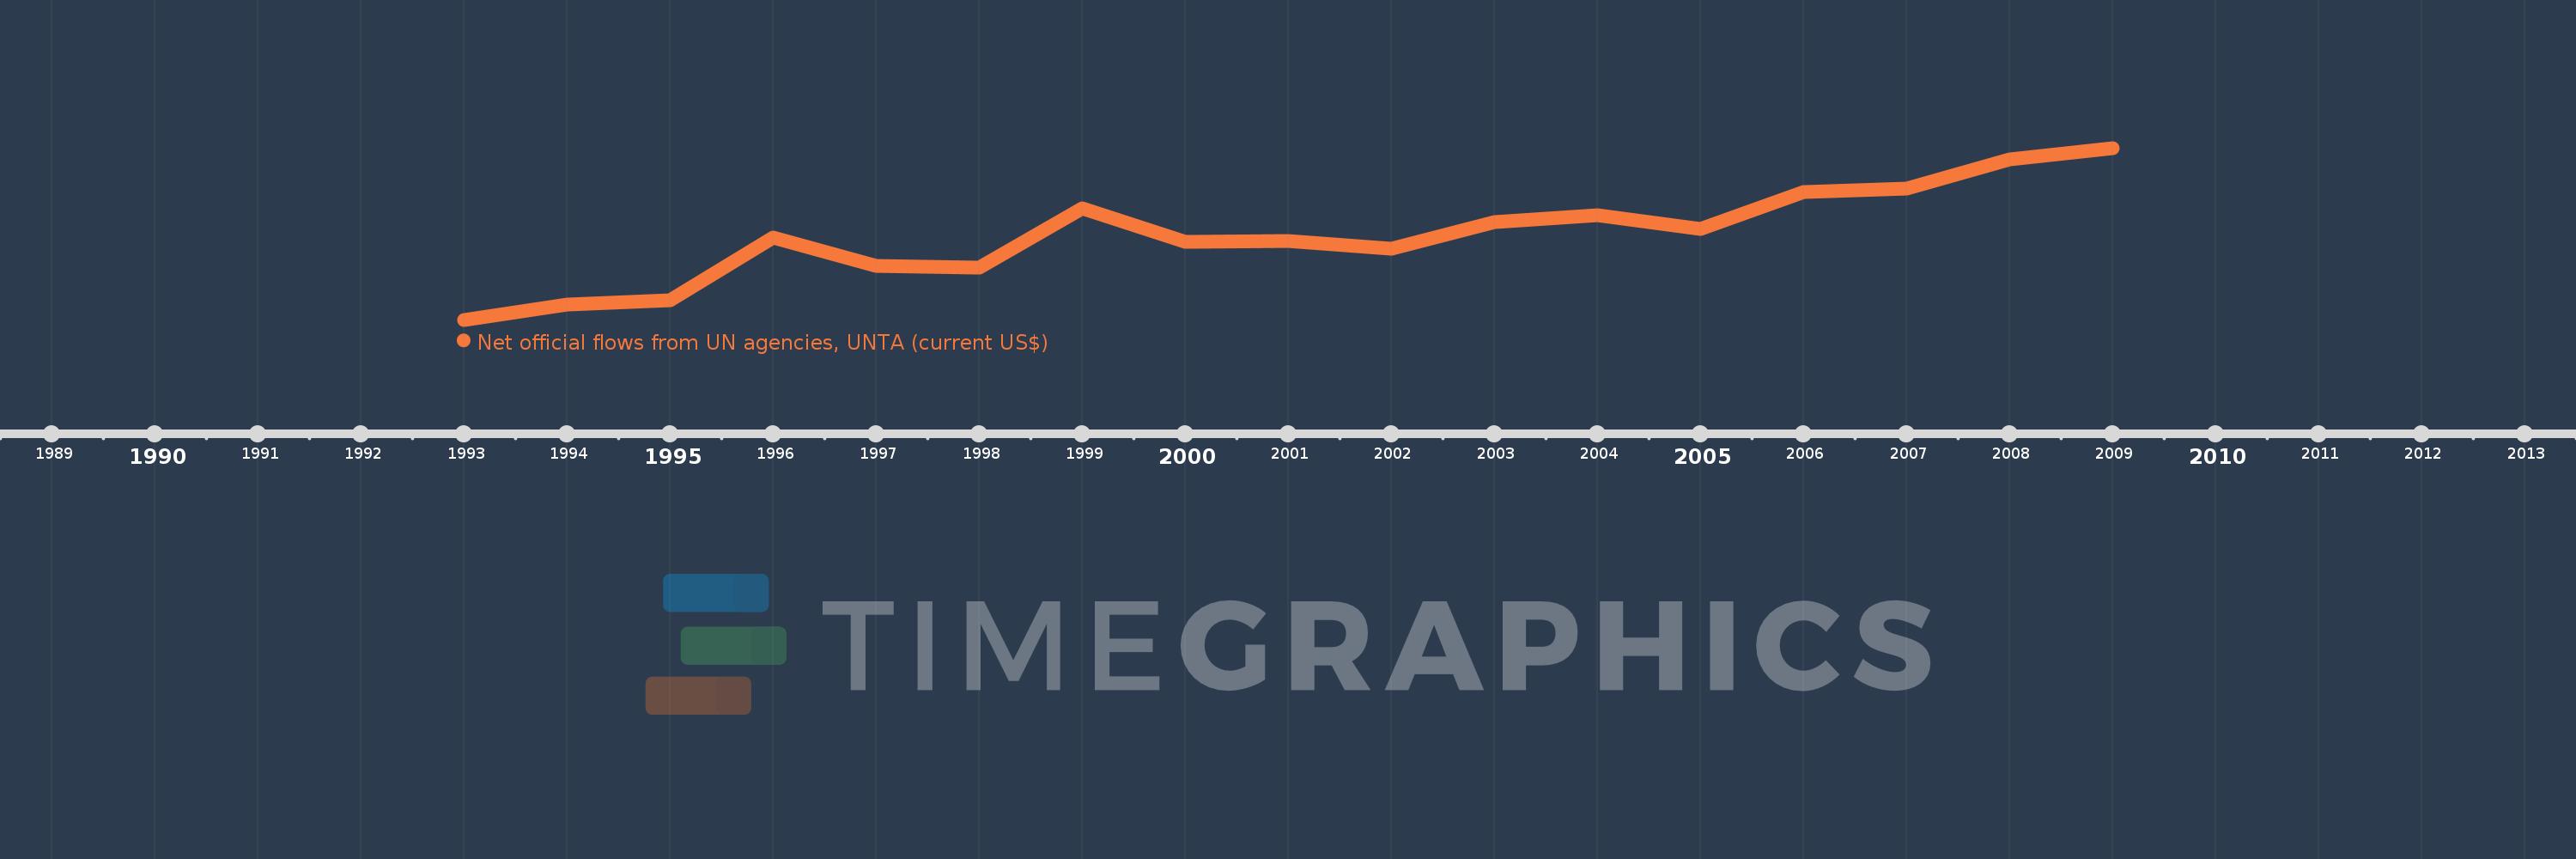
This timeline shows a graph from 1993 to 2009 of Ukraine. No data until 1992. Number of actual observations by date: 17.
Source name:
World Development Indicators
Source organization:
Development Assistance Committee of the Organisation for Economic Co-operation and Development, Geographical Distribution of Financial Flows to Developing Countries, Development Co-operation Report, and International Development Statistics database. Data are available online at: www.oecd.org/dac/stats/idsonline.
Categories, topics:
Aid Effectiveness
Last updated:
apr 23, 2017
Indicators value changes by year
Meaning:
957.647K
Minimum:
140.0K
jan 1, 1993
Maximum:
1.79 mln
jan 1, 2009
At the date of observation
Value
Absolute change
Change from the previous value
jan 1, 1993
140.0K
+140.0K
0.0%
jan 1, 1994
290.0K
+150.0K
107.14%
jan 1, 1995
330.0K
+40.0K
13.79%
jan 1, 1996
930.0K
+600.0K
181.82%
jan 1, 1997
660.0K
-270.0K
-29.03%
jan 1, 1998
640.0K
-20.0K
-3.03%
jan 1, 1999
1.21 mln
+570.0K
89.06%
jan 1, 2000
890.0K
-320.0K
-26.45%
jan 1, 2001
900.0K
+10.0K
1.12%
jan 1, 2002
820.0K
-80.0K
-8.89%
jan 1, 2003
1.08 mln
+260.0K
31.71%
jan 1, 2004
1.14 mln
+60.0K
5.56%
jan 1, 2005
1.01 mln
-130.0K
-11.4%
jan 1, 2006
1.37 mln
+360.0K
35.64%
jan 1, 2007
1.4 mln
+30.0K
2.19%
jan 1, 2008
1.68 mln
+280.0K
20.0%
jan 1, 2009
1.79 mln
+110.0K
6.55%
Ranking of countries by current statistics by years