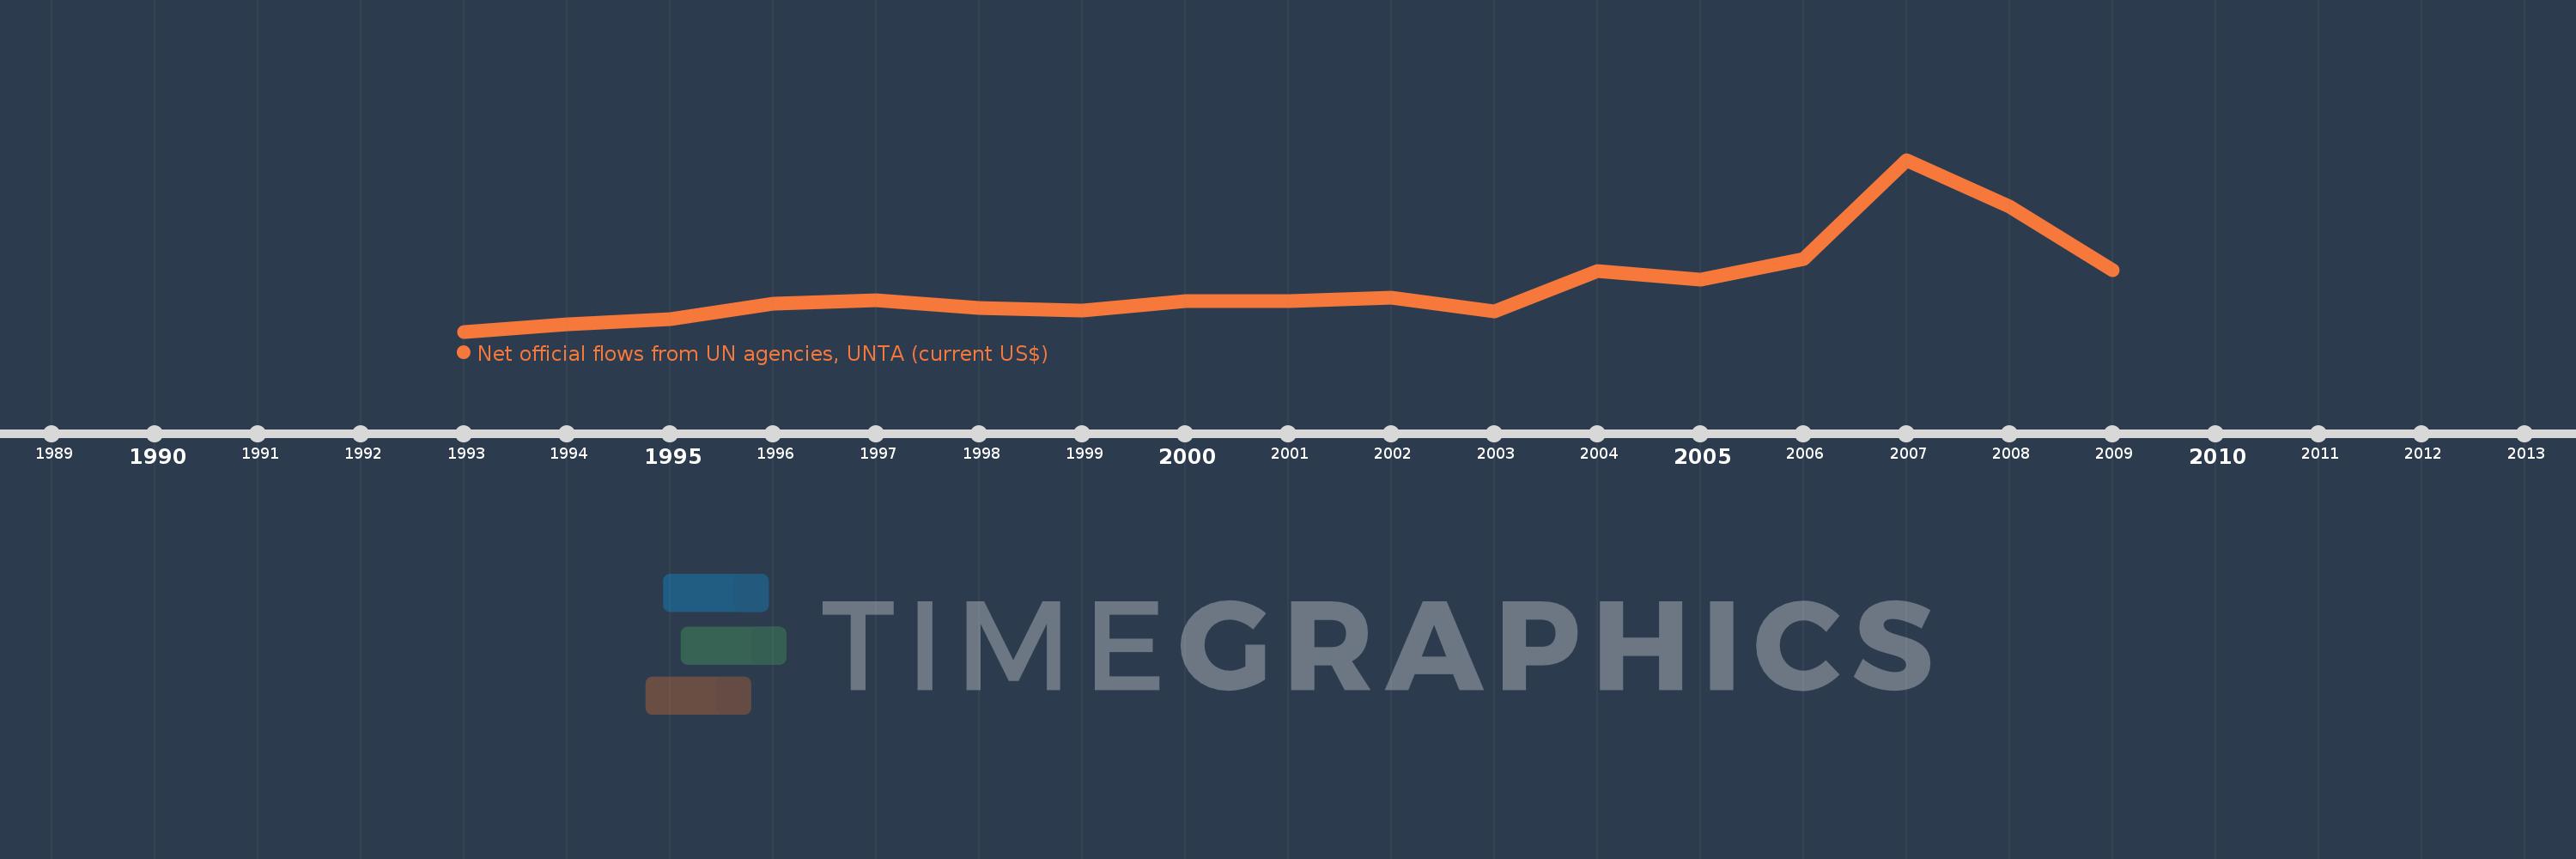
This timeline shows a graph from 1993 to 2009 of Tajikistan. No data until 1992. Number of actual observations by date: 17.
Source name:
World Development Indicators
Source organization:
Development Assistance Committee of the Organisation for Economic Co-operation and Development, Geographical Distribution of Financial Flows to Developing Countries, Development Co-operation Report, and International Development Statistics database. Data are available online at: www.oecd.org/dac/stats/idsonline.
Categories, topics:
Aid Effectiveness
Last updated:
apr 23, 2017
Indicators value changes by year
Meaning:
577.059K
Minimum:
0.0
jan 1, 1993
Maximum:
2.16 mln
jan 1, 2007
At the date of observation
Value
Absolute change
Change from the previous value
jan 1, 1993
0.0
0.0
0.0%
jan 1, 1994
90.0K
+90.0K
%
jan 1, 1995
160.0K
+70.0K
77.78%
jan 1, 1996
350.0K
+190.0K
118.75%
jan 1, 1997
390.0K
+40.0K
11.43%
jan 1, 1998
300.0K
-90.0K
-23.08%
jan 1, 1999
260.0K
-40.0K
-13.33%
jan 1, 2000
380.0K
+120.0K
46.15%
jan 1, 2001
380.0K
0.0
0.0%
jan 1, 2002
430.0K
+50.0K
13.16%
jan 1, 2003
250.0K
-180.0K
-41.86%
jan 1, 2004
760.0K
+510.0K
204.0%
jan 1, 2005
650.0K
-110.0K
-14.47%
jan 1, 2006
910.0K
+260.0K
40.0%
jan 1, 2007
2.16 mln
+1.25 mln
137.36%
jan 1, 2008
1.57 mln
-590.0K
-27.31%
jan 1, 2009
770.0K
-800.0K
-50.96%
Ranking of countries by current statistics by years