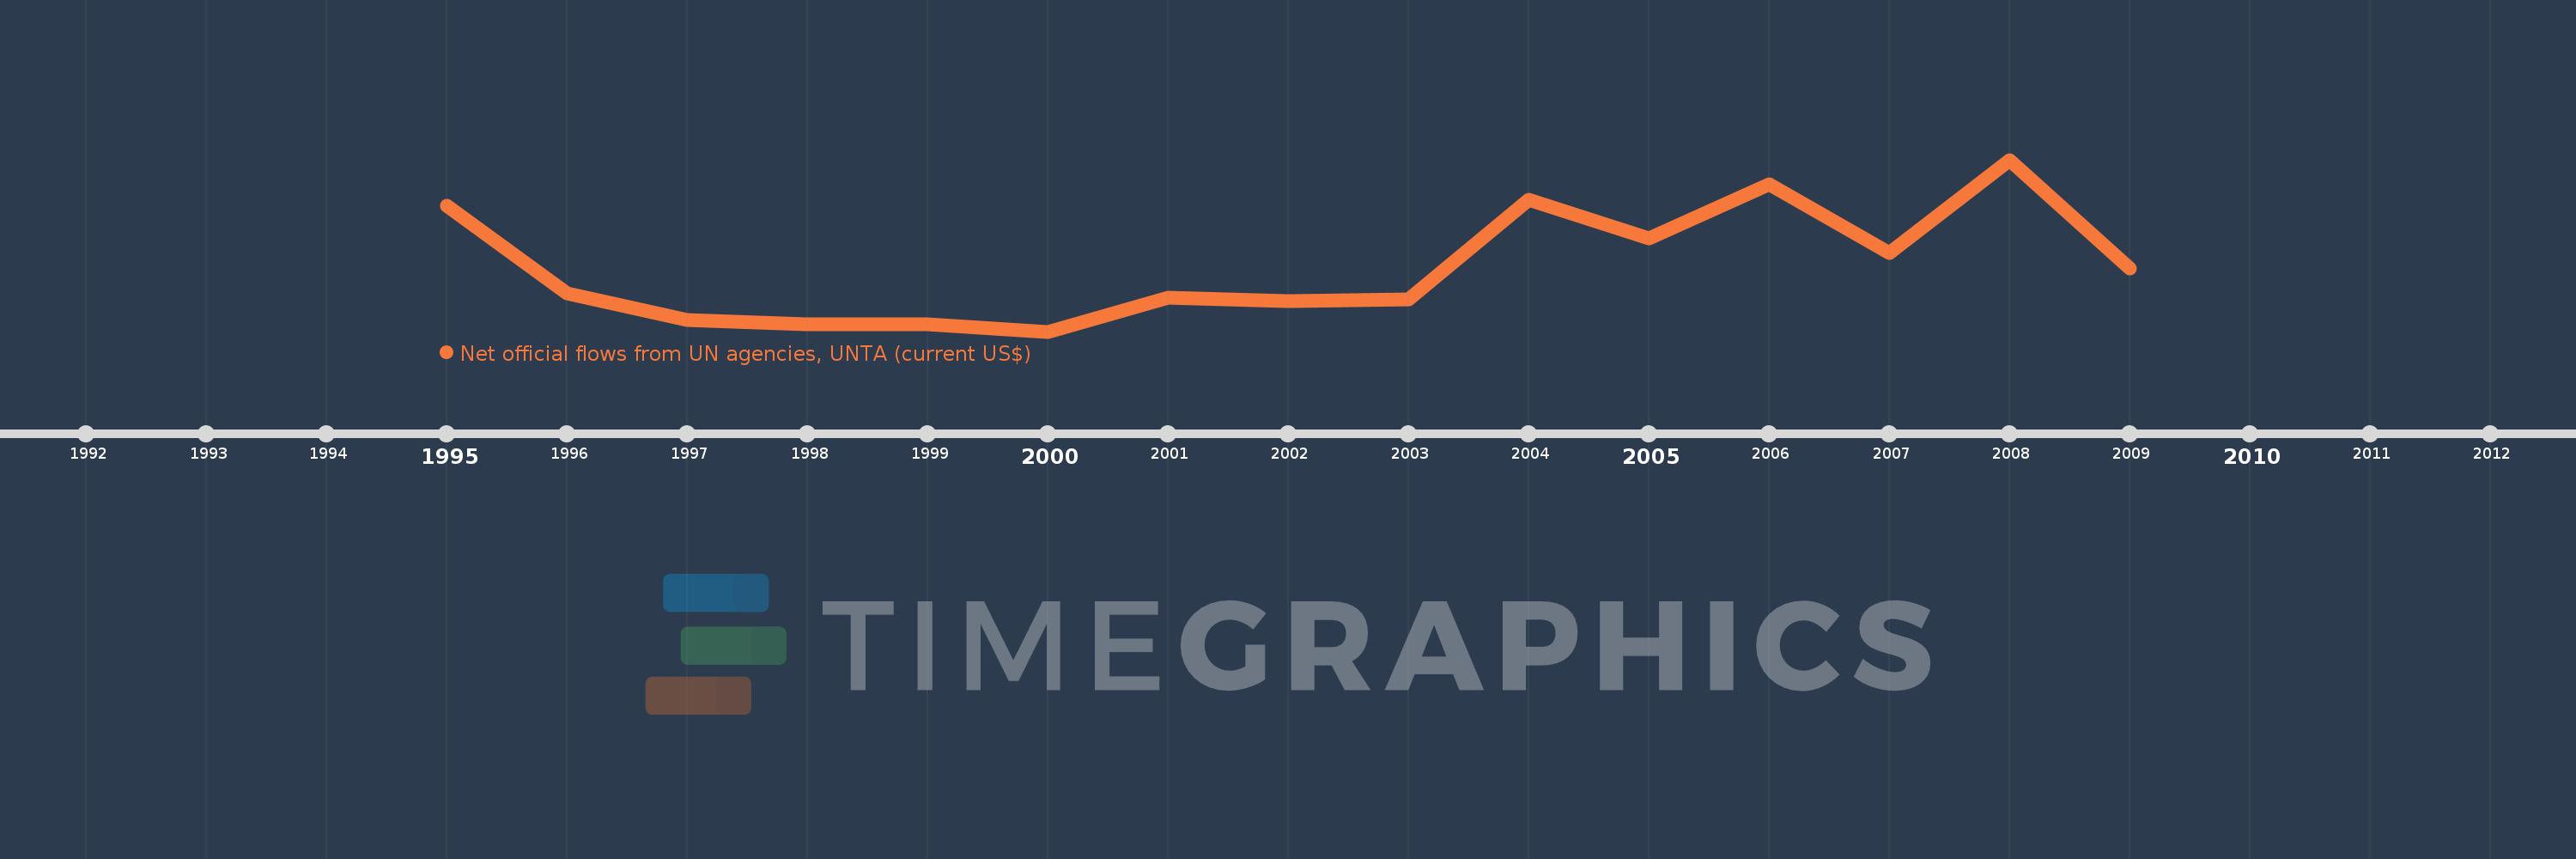
This timeline shows a graph from 1995 to 2009 of Croatia. No data until 1994. Number of actual observations by date: 15.
Source name:
World Development Indicators
Source organization:
Development Assistance Committee of the Organisation for Economic Co-operation and Development, Geographical Distribution of Financial Flows to Developing Countries, Development Co-operation Report, and International Development Statistics database. Data are available online at: www.oecd.org/dac/stats/idsonline.
Categories, topics:
Aid Effectiveness
Last updated:
apr 23, 2017
Indicators value changes by year
Meaning:
580.0K
Minimum:
240.0K
jan 1, 2000
Maximum:
1.14 mln
jan 1, 2008
At the date of observation
Value
Absolute change
Change from the previous value
jan 1, 1995
900.0K
+900.0K
0.0%
jan 1, 1996
440.0K
-460.0K
-51.11%
jan 1, 1997
300.0K
-140.0K
-31.82%
jan 1, 1998
280.0K
-20.0K
-6.67%
jan 1, 1999
280.0K
0.0
0.0%
jan 1, 2000
240.0K
-40.0K
-14.29%
jan 1, 2001
420.0K
+180.0K
75.0%
jan 1, 2002
400.0K
-20.0K
-4.76%
jan 1, 2003
410.0K
+10.0K
2.5%
jan 1, 2004
930.0K
+520.0K
126.83%
jan 1, 2005
730.0K
-200.0K
-21.51%
jan 1, 2006
1.01 mln
+280.0K
38.36%
jan 1, 2007
650.0K
-360.0K
-35.64%
jan 1, 2008
1.14 mln
+490.0K
75.38%
jan 1, 2009
570.0K
-570.0K
-50.0%
Ranking of countries by current statistics by years