33
/
AIzaSyB4mHJ5NPEv-XzF7P6NDYXjlkCWaeKw5bc
November 1, 2025
213919
Northern Mariana Islands
MNP
true
2
1
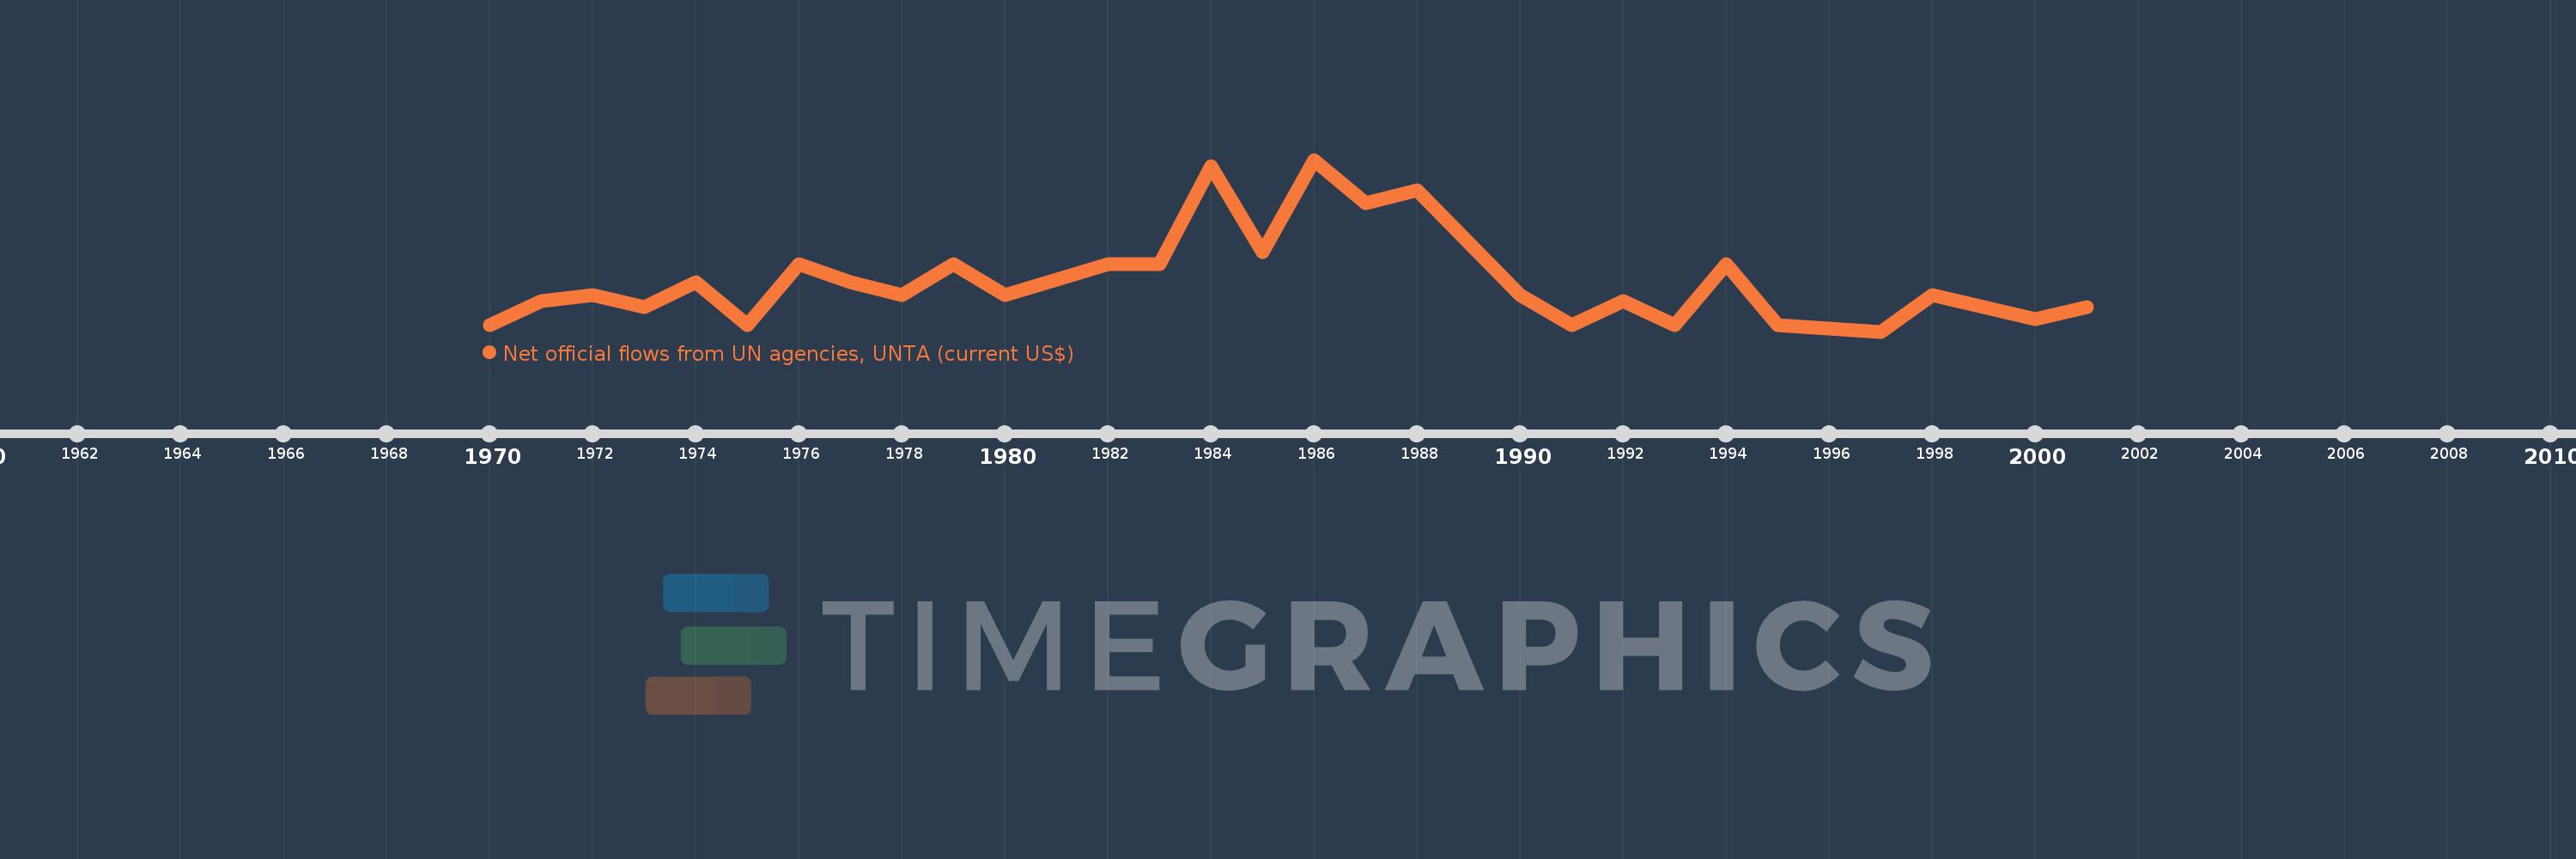
Net official flows from UN agencies, UNTA (current US$)
2001,2000,1998,1997,1995,1994,1993,1992,1991,1990,1988,1987,1986,1985,1984,1983,1982,1980,1979,1978,1977,1976,1975,1974,1973,1972,1971,1970