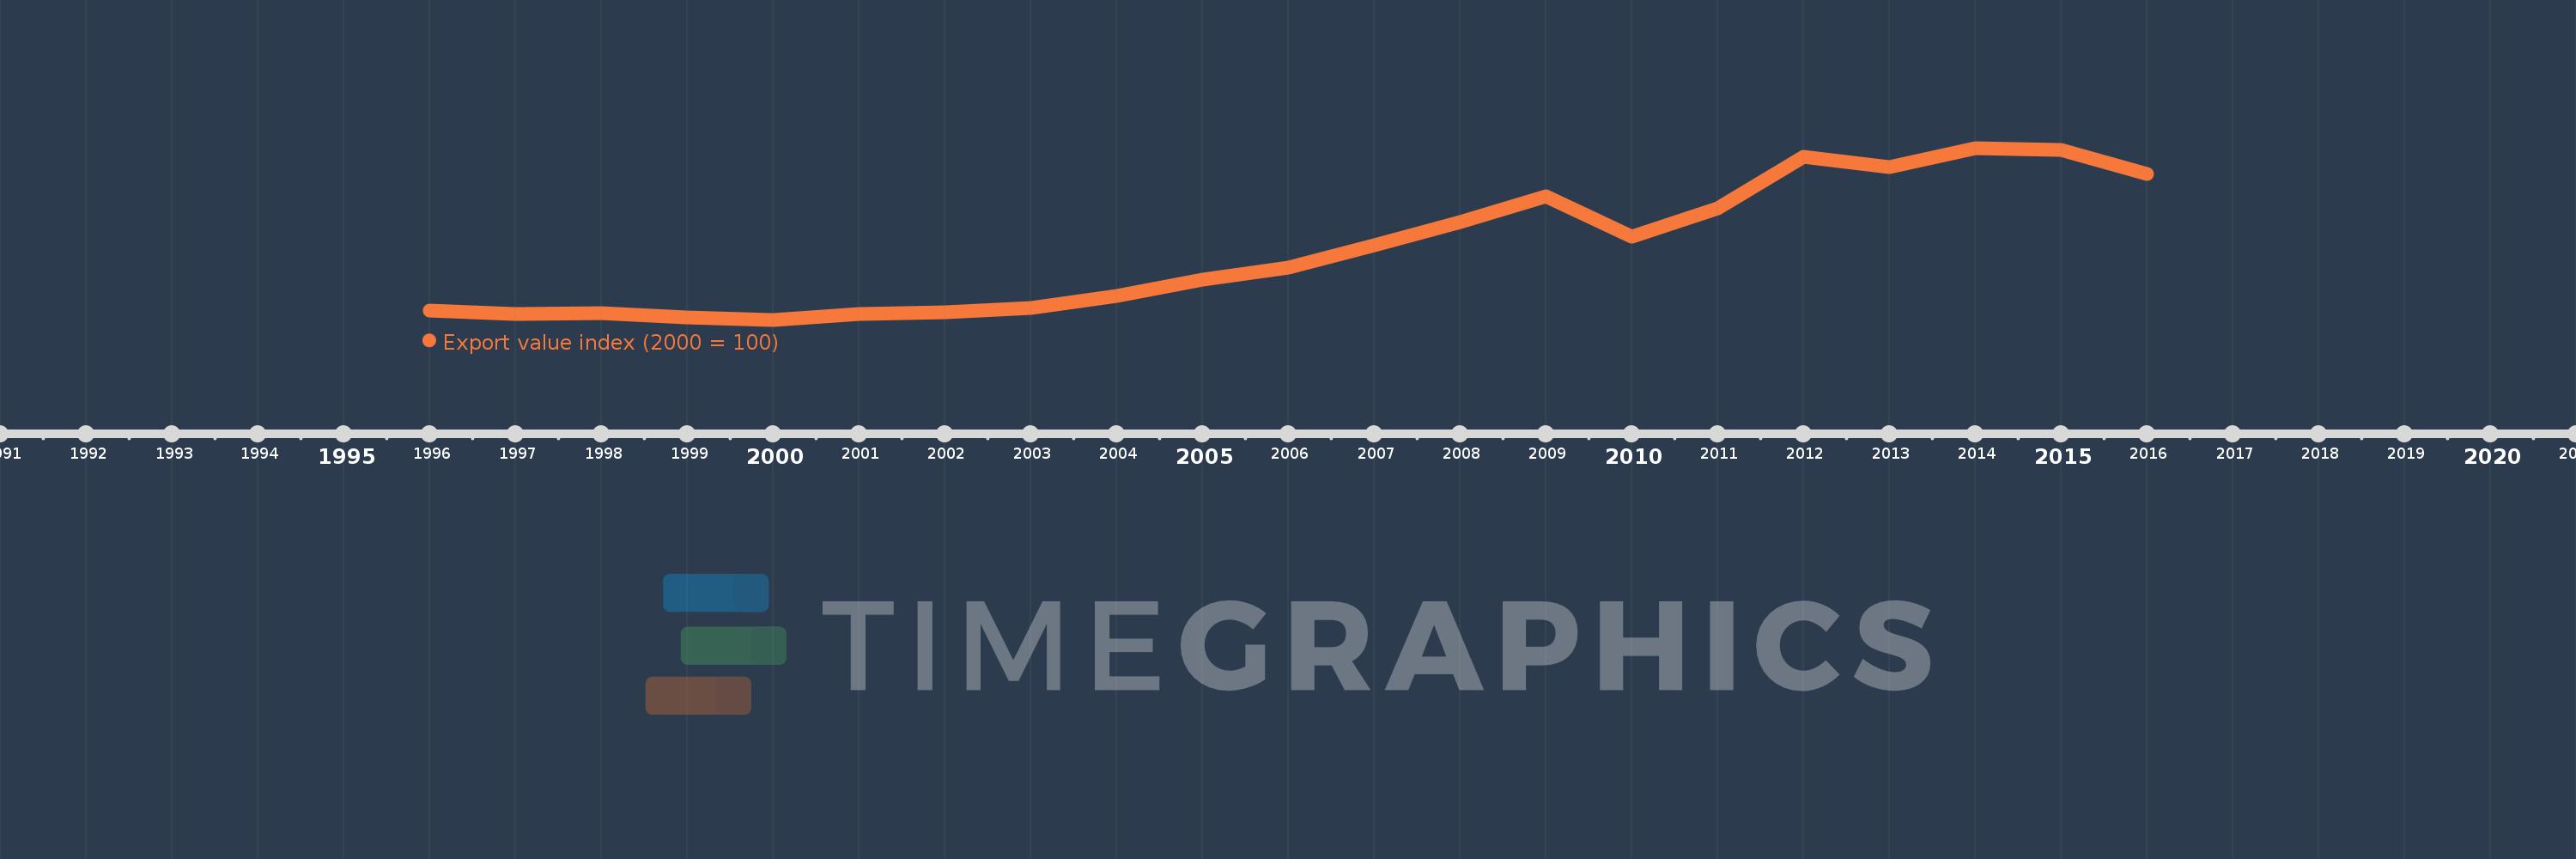
This timeline shows a graph from 1996 to 2016 of Bulgaria. No data until 1995. Number of actual observations by date: 21.
Source name:
World Development Indicators
Source organization:
United Nations Conference on Trade and Development, Handbook of Statistics and data files, and International Monetary Fund, International Financial Statistics.
Categories, topics:
Private Sector, Trade
Last updated:
apr 23, 2017
Indicators value changes by year
Meaning:
295.155
Minimum:
82.021
jan 1, 2000
Maximum:
609.662
jan 1, 2014
At the date of observation
Value
Absolute change
Change from the previous value
jan 1, 1996
110.373
+110.373
0.0%
jan 1, 1997
100.789
-9.584
-8.68%
jan 1, 1998
101.819
+1.031
1.02%
jan 1, 1999
88.628
-13.191
-12.96%
jan 1, 2000
82.021
-6.607
-7.46%
jan 1, 2001
100.0
+17.979
21.92%
jan 1, 2002
105.481
+5.481
5.48%
jan 1, 2003
118.165
+12.683
12.02%
jan 1, 2004
155.472
+37.307
31.57%
jan 1, 2005
204.718
+49.246
31.68%
jan 1, 2006
241.955
+37.237
18.19%
jan 1, 2007
310.491
+68.536
28.33%
jan 1, 2008
381.684
+71.193
22.93%
jan 1, 2009
460.911
+79.227
20.76%
jan 1, 2010
336.341
-124.569
-27.03%
jan 1, 2011
425.204
+88.862
26.42%
jan 1, 2012
581.408
+156.204
36.74%
jan 1, 2013
550.029
-31.379
-5.4%
jan 1, 2014
609.662
+59.633
10.84%
jan 1, 2015
603.6
-6.062
-0.99%
jan 1, 2016
529.504
-74.095
-12.28%
Ranking of countries by current statistics by years