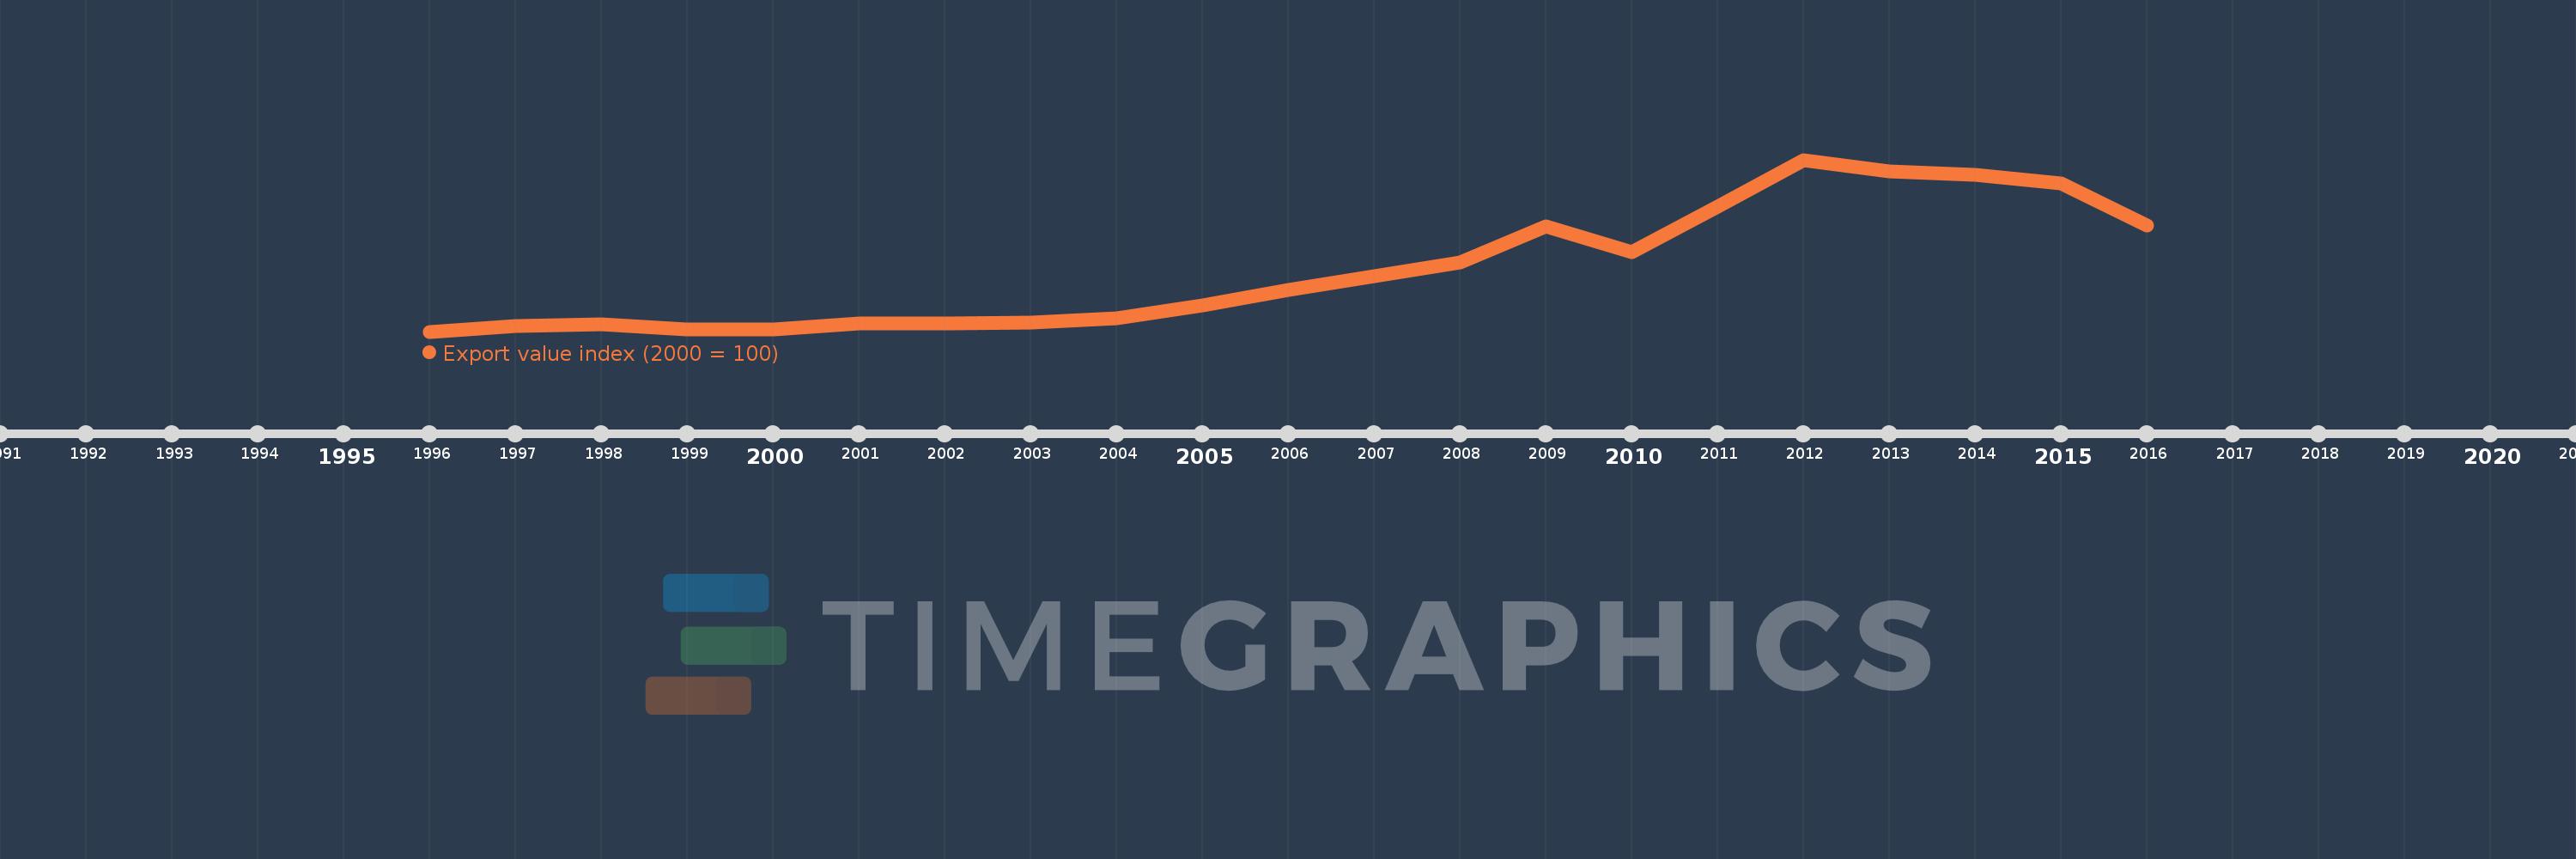
This timeline shows a graph from 1996 to 2016 of Australia. No data until 1995. Number of actual observations by date: 21.
Source name:
World Development Indicators
Source organization:
United Nations Conference on Trade and Development, Handbook of Statistics and data files, and International Monetary Fund, International Financial Statistics.
Categories, topics:
Private Sector, Trade
Last updated:
apr 23, 2017
Indicators value changes by year
Meaning:
206.796
Minimum:
83.155
jan 1, 1996
Maximum:
425.444
jan 1, 2012
At the date of observation
Value
Absolute change
Change from the previous value
jan 1, 1996
83.155
+83.155
0.0%
jan 1, 1997
94.411
+11.256
13.54%
jan 1, 1998
98.496
+4.085
4.33%
jan 1, 1999
87.51
-10.986
-11.15%
jan 1, 2000
87.802
+0.292
0.33%
jan 1, 2001
100.0
+12.198
13.89%
jan 1, 2002
99.243
-0.757
-0.76%
jan 1, 2003
101.82
+2.577
2.6%
jan 1, 2004
110.187
+8.367
8.22%
jan 1, 2005
135.531
+25.344
23.0%
jan 1, 2006
166.113
+30.582
22.56%
jan 1, 2007
193.262
+27.149
16.34%
jan 1, 2008
221.321
+28.058
14.52%
jan 1, 2009
293.182
+71.862
32.47%
jan 1, 2010
241.632
-51.551
-17.58%
jan 1, 2011
332.915
+91.284
37.78%
jan 1, 2012
425.444
+92.529
27.79%
jan 1, 2013
401.868
-23.576
-5.54%
jan 1, 2014
396.085
-5.784
-1.44%
jan 1, 2015
377.699
-18.386
-4.64%
jan 1, 2016
295.043
-82.656
-21.88%
Ranking of countries by current statistics by years