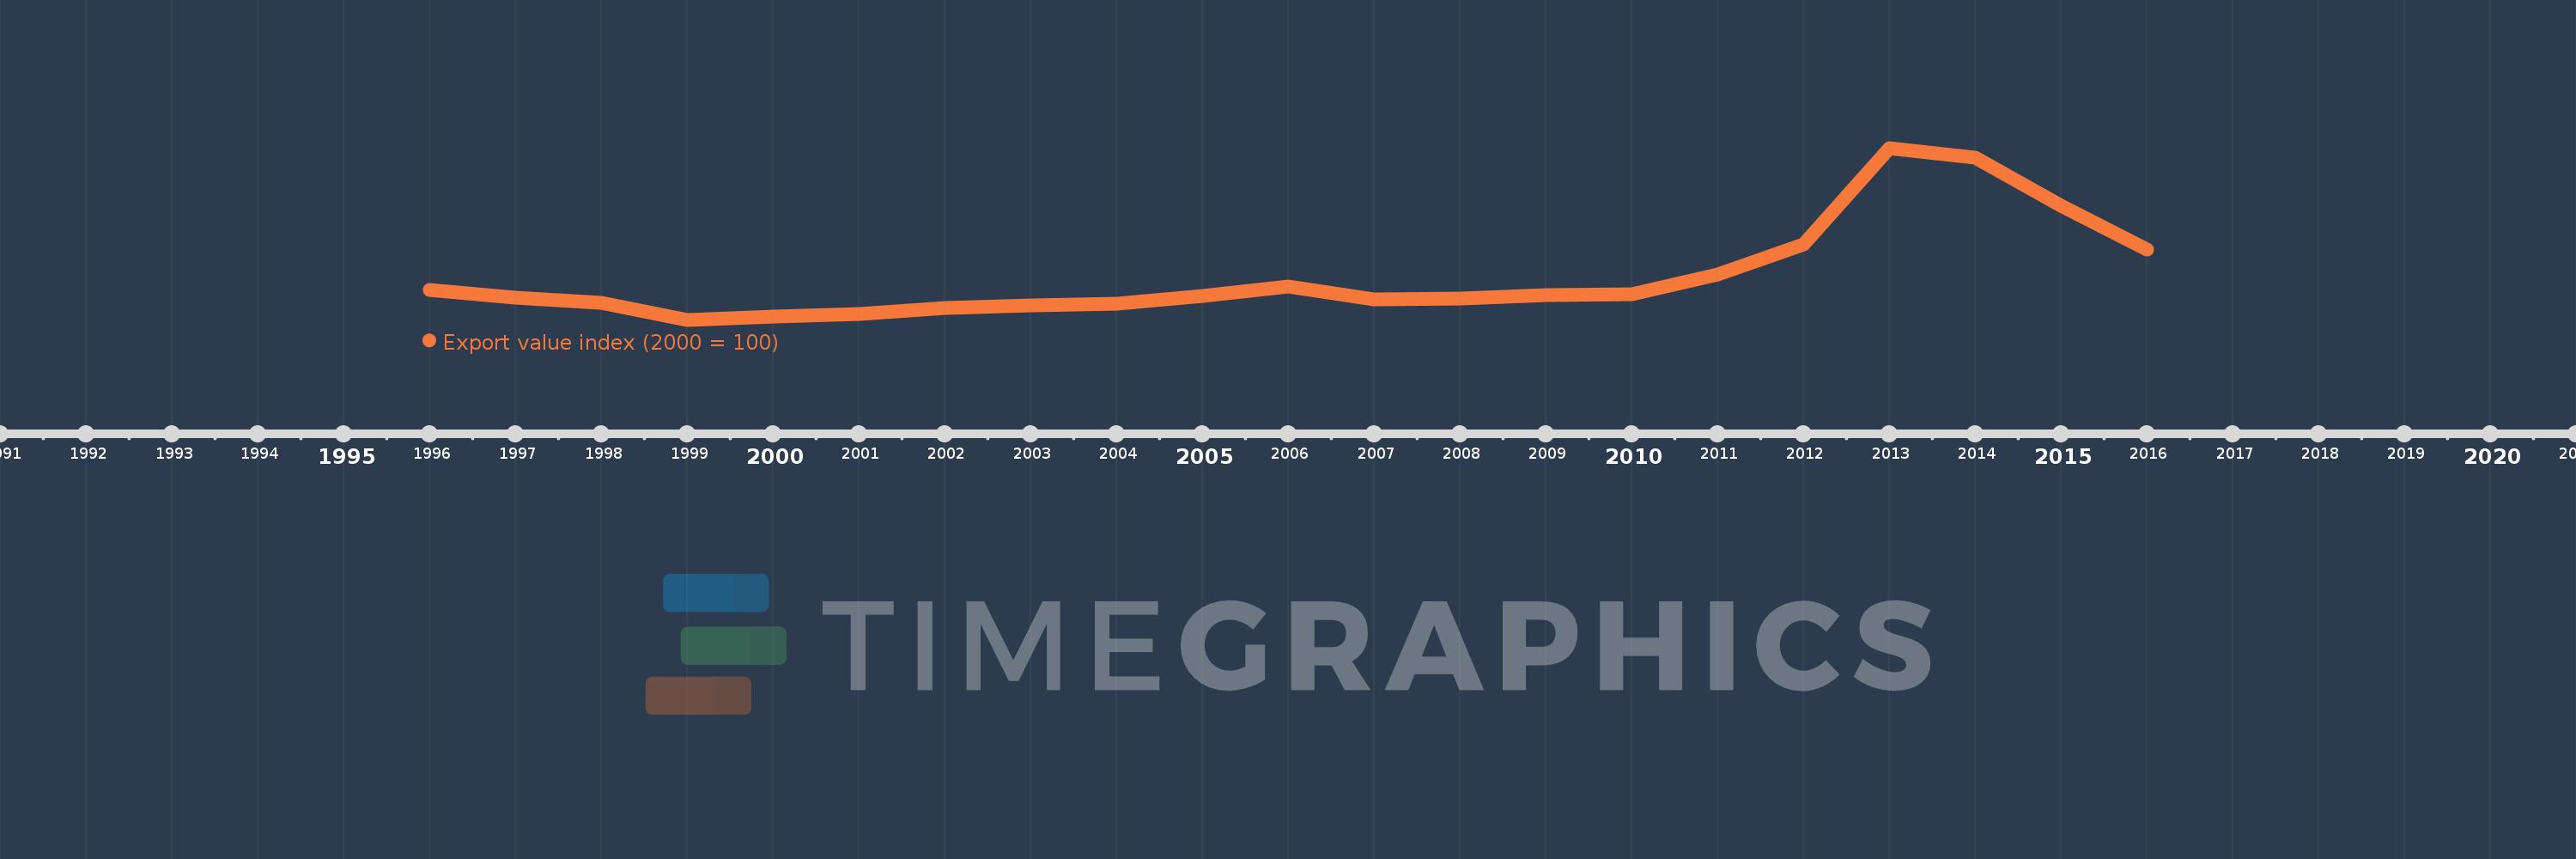
This timeline shows a graph from 1996 to 2016 of Marshall Islands. No data until 1995. Number of actual observations by date: 21.
Source name:
World Development Indicators
Source organization:
United Nations Conference on Trade and Development, Handbook of Statistics and data files, and International Monetary Fund, International Financial Statistics.
Categories, topics:
Private Sector, Trade
Last updated:
apr 23, 2017
Indicators value changes by year
Meaning:
341.771
Minimum:
63.284
jan 1, 1999
Maximum:
1.17K
jan 1, 2013
At the date of observation
Value
Absolute change
Change from the previous value
jan 1, 1996
252.861
+252.861
0.0%
jan 1, 1997
207.398
-45.463
-17.98%
jan 1, 1998
172.918
-34.48
-16.63%
jan 1, 1999
63.284
-109.634
-63.4%
jan 1, 2000
83.976
+20.693
32.7%
jan 1, 2001
100.0
+16.024
19.08%
jan 1, 2002
139.906
+39.906
39.91%
jan 1, 2003
156.313
+16.407
11.73%
jan 1, 2004
166.648
+10.335
6.61%
jan 1, 2005
216.802
+50.153
30.1%
jan 1, 2006
277.937
+61.135
28.2%
jan 1, 2007
196.186
-81.751
-29.41%
jan 1, 2008
200.57
+4.384
2.23%
jan 1, 2009
221.394
+20.824
10.38%
jan 1, 2010
227.97
+6.576
2.97%
jan 1, 2011
354.011
+126.041
55.29%
jan 1, 2012
549.101
+195.09
55.11%
jan 1, 2013
1.17K
+621.317
113.15%
jan 1, 2014
1.11K
-60.837
-5.2%
jan 1, 2015
796.528
-313.054
-28.21%
jan 1, 2016
513.396
-283.132
-35.55%
Ranking of countries by current statistics by years