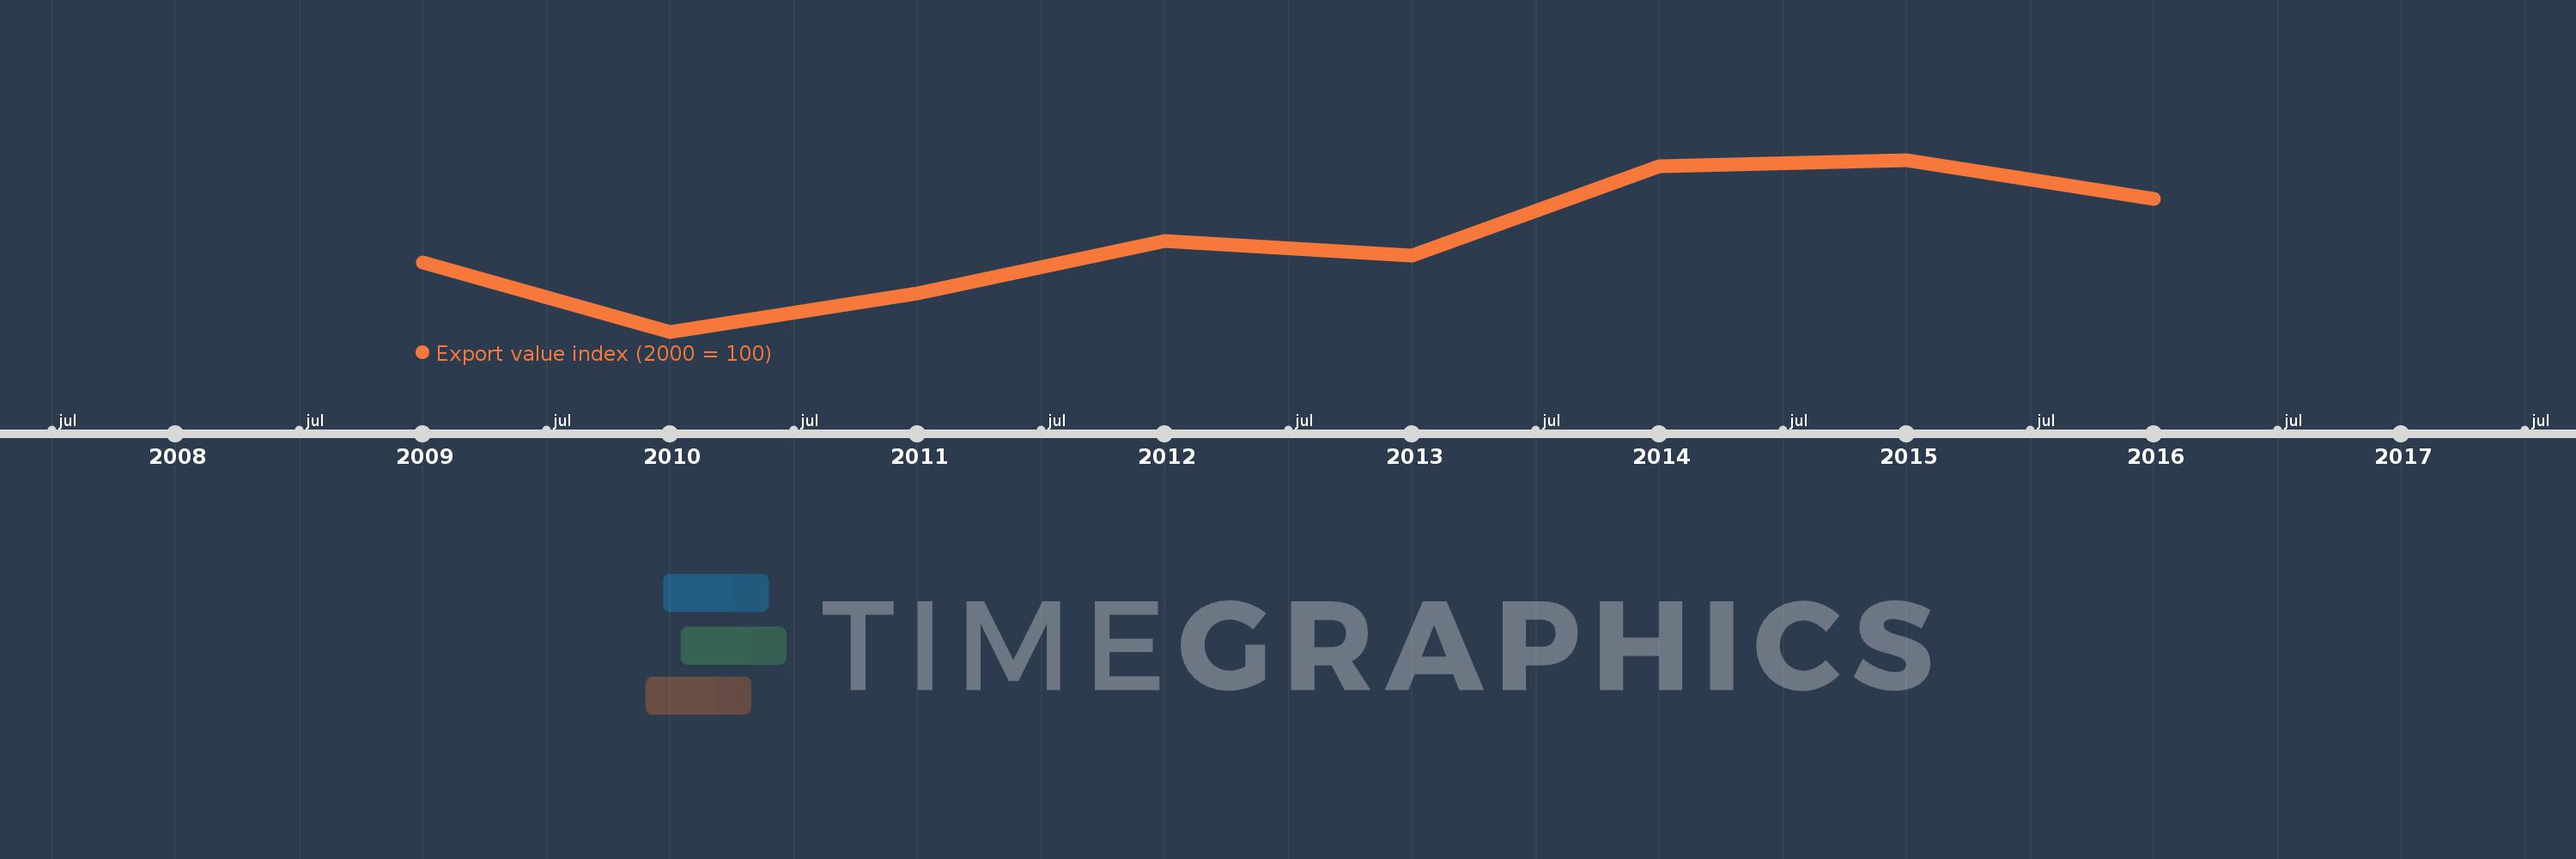
This timeline shows a graph from 2009 to 2016 of Serbia. No data until 2008. Number of actual observations by date: 8.
Source name:
World Development Indicators
Source organization:
United Nations Conference on Trade and Development, Handbook of Statistics and data files, and International Monetary Fund, International Financial Statistics.
Categories, topics:
Private Sector, Trade
Last updated:
apr 23, 2017
Indicators value changes by year
Meaning:
688.723
Minimum:
484.334
jan 1, 2010
Maximum:
861.59
jan 1, 2015
At the date of observation
Value
Absolute change
Change from the previous value
jan 1, 2009
636.801
+636.801
0.0%
jan 1, 2010
484.334
-152.467
-23.94%
jan 1, 2011
568.457
+84.123
17.37%
jan 1, 2012
683.661
+115.204
20.27%
jan 1, 2013
651.712
-31.949
-4.67%
jan 1, 2014
848.131
+196.419
30.14%
jan 1, 2015
861.59
+13.459
1.59%
jan 1, 2016
775.096
-86.494
-10.04%
Ranking of countries by current statistics by years