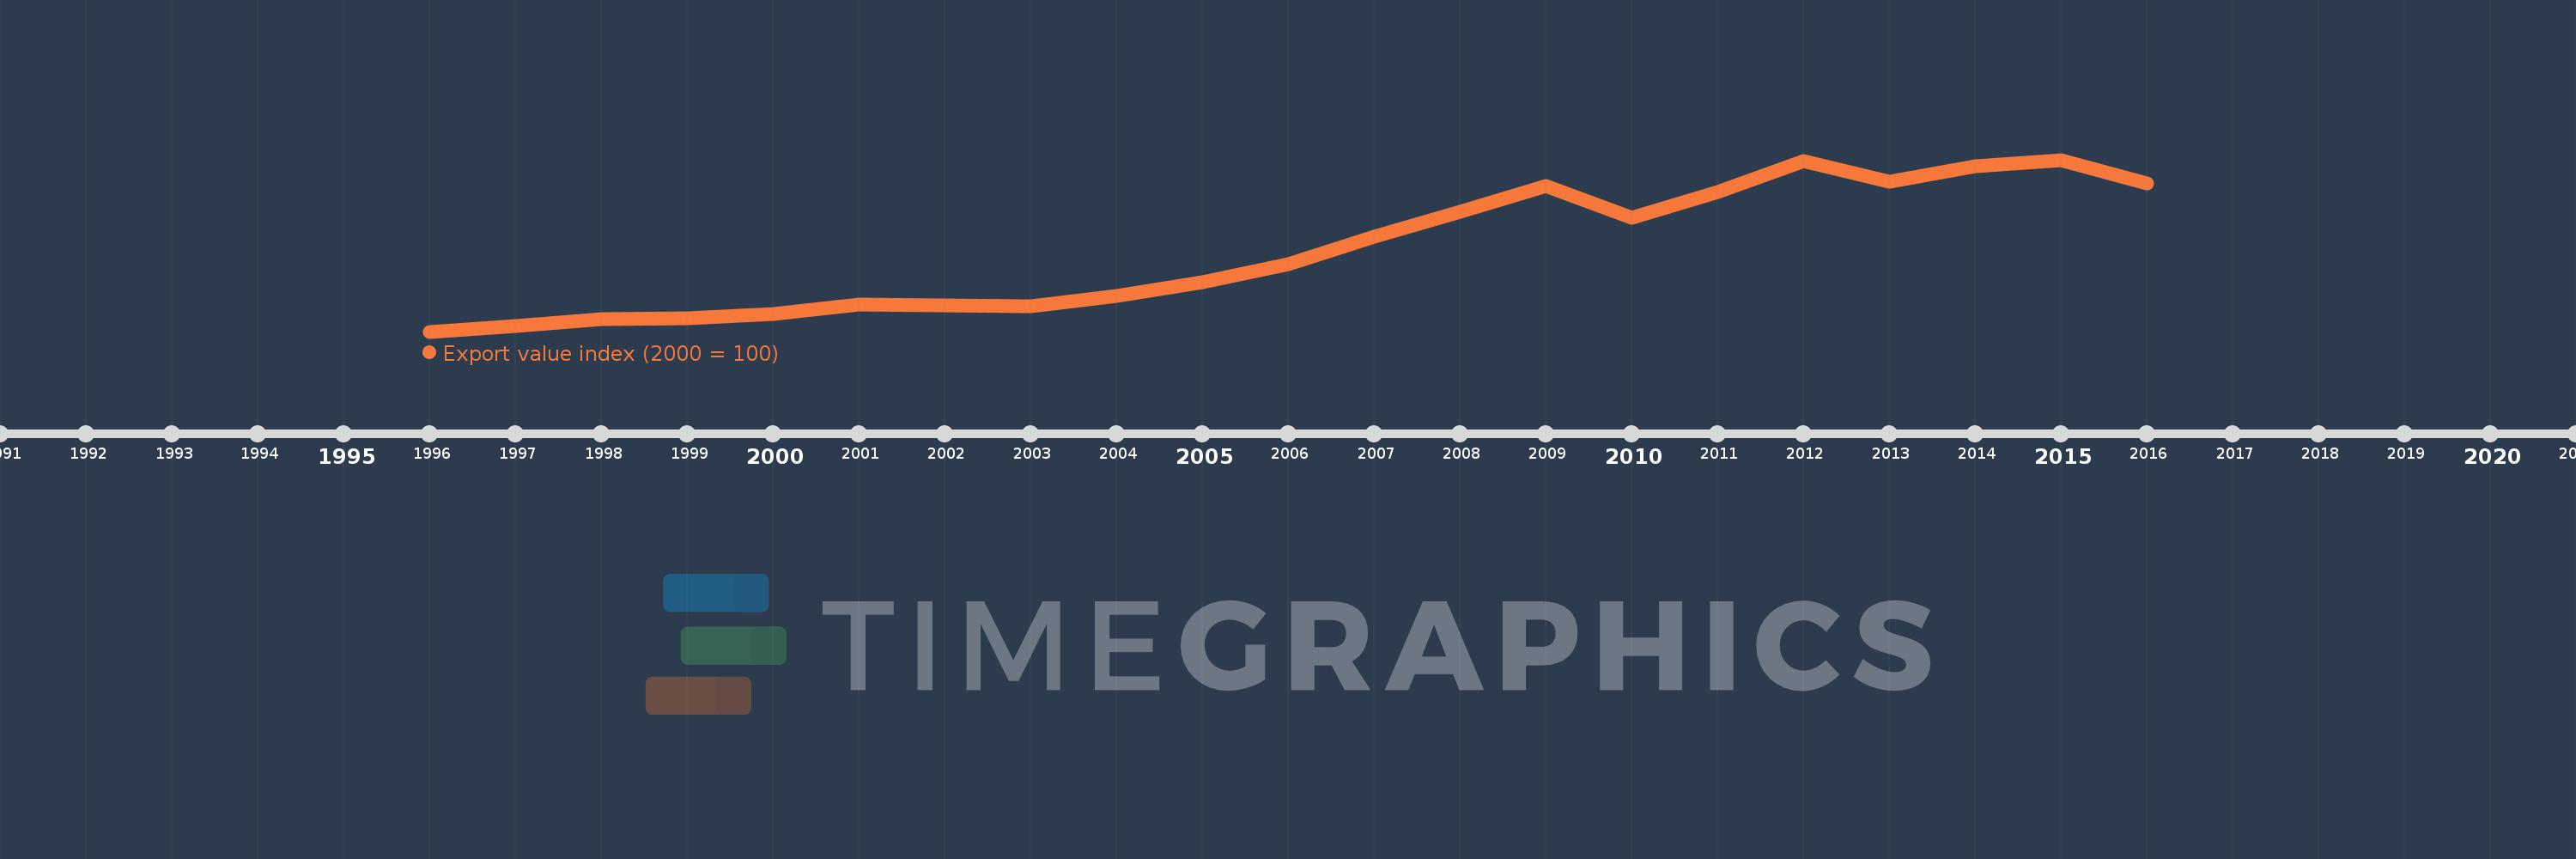
This timeline shows a graph from 1996 to 2016 of Bosnia and Herzegovina. No data until 1995. Number of actual observations by date: 21.
Source name:
World Development Indicators
Source organization:
United Nations Conference on Trade and Development, Handbook of Statistics and data files, and International Monetary Fund, International Financial Statistics.
Categories, topics:
Private Sector, Trade
Last updated:
apr 23, 2017
Indicators value changes by year
Meaning:
267.273
Minimum:
14.219
jan 1, 1996
Maximum:
551.05
jan 1, 2015
At the date of observation
Value
Absolute change
Change from the previous value
jan 1, 1996
14.219
+14.219
0.0%
jan 1, 1997
31.431
+17.212
121.05%
jan 1, 1998
53.789
+22.357
71.13%
jan 1, 1999
56.595
+2.806
5.22%
jan 1, 2000
70.253
+13.658
24.13%
jan 1, 2001
100.0
+29.747
42.34%
jan 1, 2002
96.539
-3.461
-3.46%
jan 1, 2003
94.04
-2.499
-2.59%
jan 1, 2004
125.351
+31.311
33.3%
jan 1, 2005
167.696
+42.346
33.78%
jan 1, 2006
224.509
+56.813
33.88%
jan 1, 2007
310.851
+86.342
38.46%
jan 1, 2008
388.397
+77.546
24.95%
jan 1, 2009
469.699
+81.302
20.93%
jan 1, 2010
369.871
-99.828
-21.25%
jan 1, 2011
449.309
+79.438
21.48%
jan 1, 2012
547.248
+97.939
21.8%
jan 1, 2013
482.863
-64.384
-11.77%
jan 1, 2014
532.022
+49.159
10.18%
jan 1, 2015
551.05
+19.028
3.58%
jan 1, 2016
476.999
-74.051
-13.44%
Ranking of countries by current statistics by years