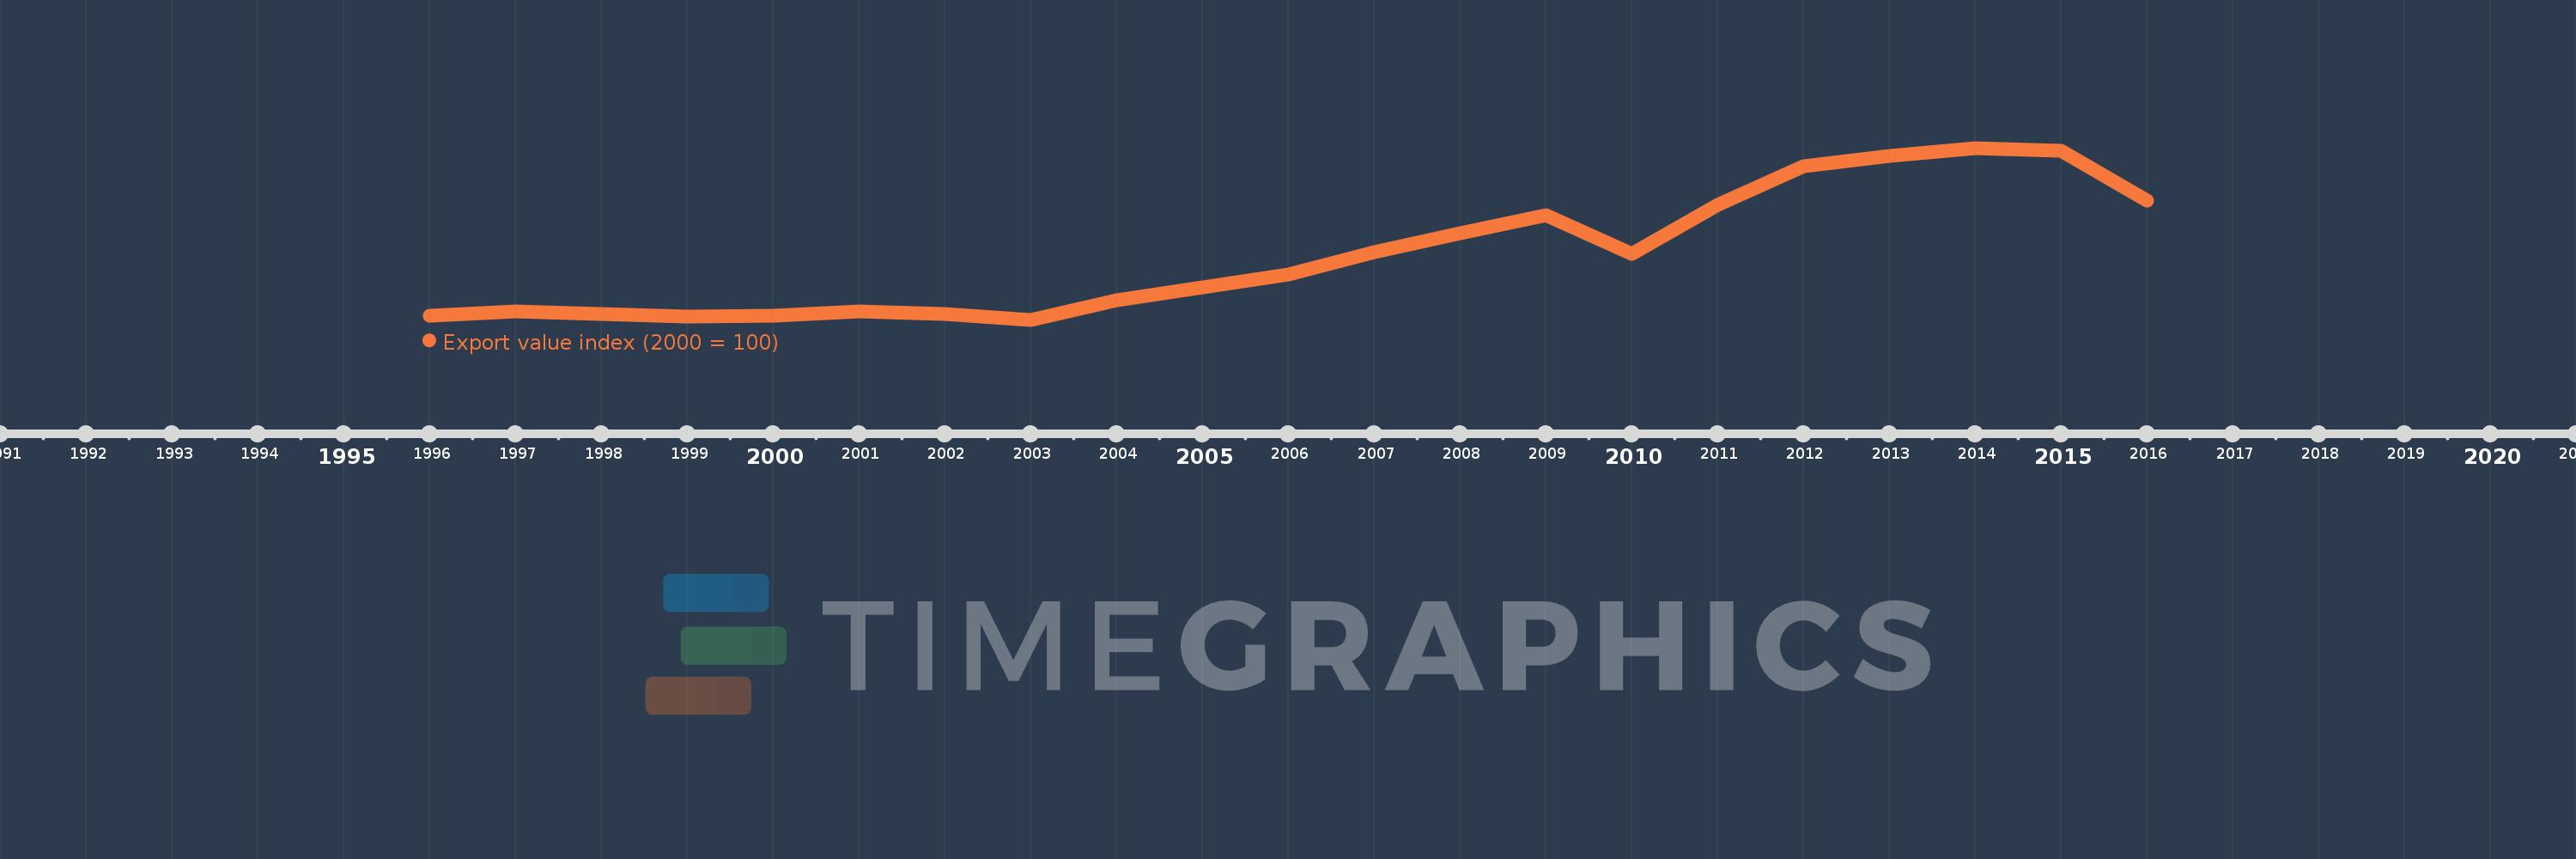
This timeline shows a graph from 1996 to 2016 of Greece. No data until 1995. Number of actual observations by date: 21.
Source name:
World Development Indicators
Source organization:
United Nations Conference on Trade and Development, Handbook of Statistics and data files, and International Monetary Fund, International Financial Statistics.
Categories, topics:
Private Sector, Trade
Last updated:
apr 23, 2017
Indicators value changes by year
Meaning:
172.751
Minimum:
88.846
jan 1, 2003
Maximum:
312.251
jan 1, 2014
At the date of observation
Value
Absolute change
Change from the previous value
jan 1, 1996
94.3
+94.3
0.0%
jan 1, 1997
99.739
+5.439
5.77%
jan 1, 1998
96.657
-3.082
-3.09%
jan 1, 1999
92.588
-4.068
-4.21%
jan 1, 2000
94.526
+1.937
2.09%
jan 1, 2001
100.0
+5.474
5.79%
jan 1, 2002
96.846
-3.154
-3.15%
jan 1, 2003
88.846
-8.0
-8.26%
jan 1, 2004
114.165
+25.319
28.5%
jan 1, 2005
130.596
+16.431
14.39%
jan 1, 2006
147.407
+16.811
12.87%
jan 1, 2007
177.017
+29.61
20.09%
jan 1, 2008
201.151
+24.134
13.63%
jan 1, 2009
225.07
+23.918
11.89%
jan 1, 2010
174.628
-50.442
-22.41%
jan 1, 2011
238.451
+63.824
36.55%
jan 1, 2012
288.522
+50.071
21.0%
jan 1, 2013
302.361
+13.839
4.8%
jan 1, 2014
312.251
+9.89
3.27%
jan 1, 2015
308.517
-3.735
-1.2%
jan 1, 2016
244.142
-64.375
-20.87%
Ranking of countries by current statistics by years