33
/
AIzaSyAYiBZKx7MnpbEhh9jyipgxe19OcubqV5w
August 1, 2025
128226
Eritrea
ERI
true
2
1
Export value index (2000 = 100)
2016,2015,2014,2013,2012,2011,2010,2009,2008,2007,2006,2005,2004,2003,2002,2001,2000,1999,1998,1997,1996,1995,1994
Download
Global statistics library →Eritrea →

Export value index (2000 = 100)

This statistics in other country:

AfghanistanAlbaniaAlgeriaAmerican SamoaAndorraAngolaAntigua and BarbudaArgentinaArmeniaArubaAustraliaAustriaAzerbaijanBahamas, TheBahrainBangladeshBarbadosBelarusBelgiumBelizeBeninBermudaBhutanBoliviaBosnia and HerzegovinaBotswanaBrazilBritish Virgin IslandsBrunei DarussalamBulgariaBurkina FasoBurundiCabo VerdeCambodiaCameroonCanadaCayman IslandsCentral African RepublicChadChileChinaColombiaComorosCongo, Dem. Rep.Congo, Rep.Costa RicaCote d'IvoireCroatiaCubaCuracaoCyprusCzech RepublicDenmarkDjiboutiDominicaDominican RepublicEcuadorEgypt, Arab Rep.El SalvadorEquatorial GuineaEritreaEstoniaEthiopiaFaroe IslandsFijiFinlandFranceFrench PolynesiaGabonGambia, TheGeorgiaGermanyGhanaGibraltarGreeceGreenlandGrenadaGuamGuatemalaGuineaGuinea-BissauGuyanaHaitiHondurasHong Kong SAR, ChinaHungaryIcelandIndiaIndonesiaIran, Islamic Rep.IraqIrelandIsraelItalyJamaicaJapanJordanKazakhstanKenyaKiribatiKorea, Dem. People’s Rep.Korea, Rep.KuwaitKyrgyz RepublicLao PDRLatviaLebanonLesothoLiberiaLibyaLithuaniaLuxembourgMacao SAR, ChinaMacedonia, FYRMadagascarMalawiMalaysiaMaldivesMaliMaltaMarshall IslandsMauritaniaMauritiusMexicoMicronesia, Fed. Sts.MoldovaMongoliaMoroccoMozambiqueMyanmarNamibiaNauruNepalNetherlandsNew CaledoniaNew ZealandNicaraguaNigerNigeriaNorthern Mariana IslandsNorwayOmanPakistanPalauPanamaPapua New GuineaParaguayPeruPhilippinesPolandPortugalQatarRomaniaRussian FederationRwandaSamoaSao Tome and PrincipeSaudi ArabiaSenegalSerbiaSeychellesSierra LeoneSingaporeSlovak RepublicSloveniaSolomon IslandsSomaliaSouth AfricaSpainSri LankaSt. Kitts and NevisSt. LuciaSt. Vincent and the GrenadinesSudanSurinameSwazilandSwedenSwitzerlandSyrian Arab RepublicTajikistanTanzaniaThailandTogoTongaTrinidad and TobagoTunisiaTurkeyTurkmenistanTurks and Caicos IslandsUgandaUkraineUnited Arab EmiratesUnited KingdomUnited StatesUruguayUzbekistanVanuatuVenezuela, RBVietnamWest Bank and GazaYemen, Rep.ZambiaZimbabwe

Timeline:

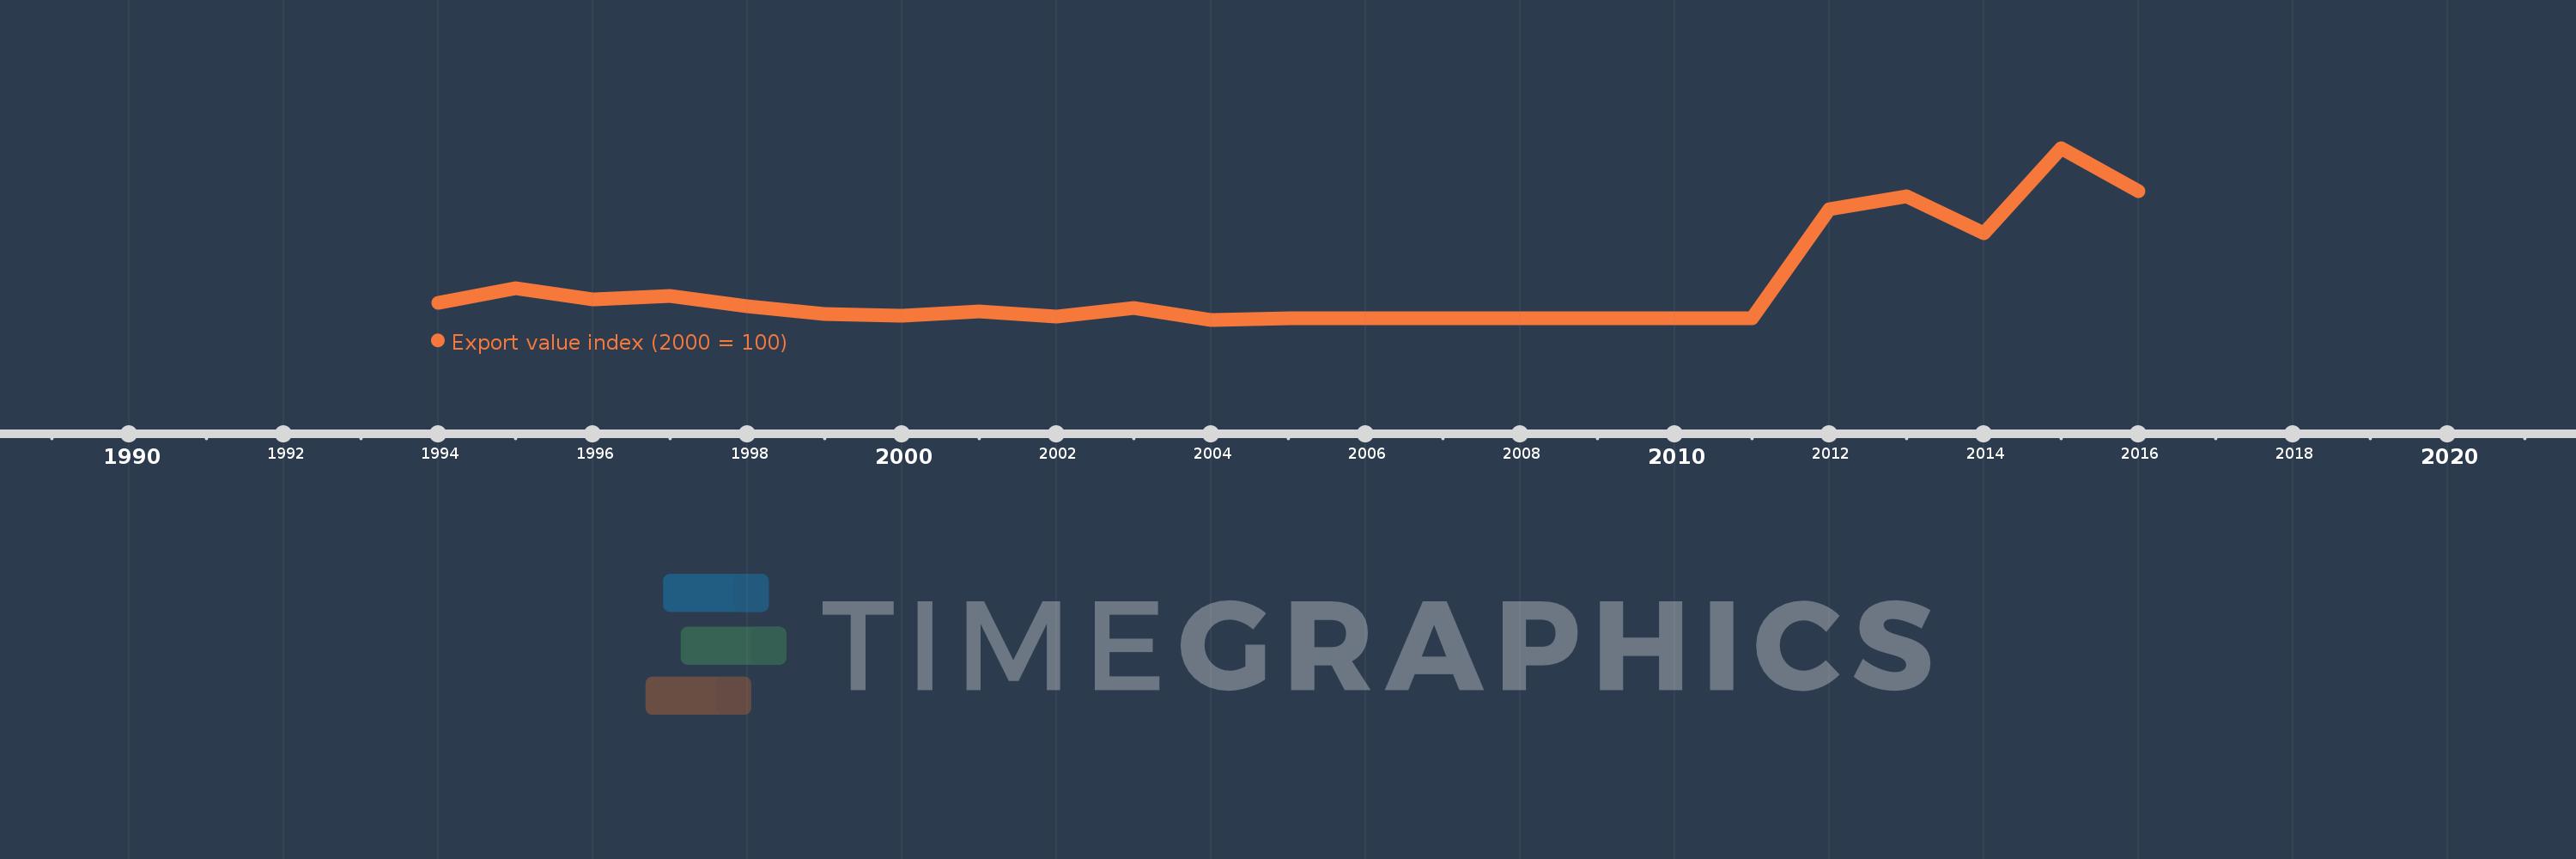
This timeline shows a graph from 1994 to 2016 of Eritrea. No data until 1993. Number of actual observations by date: 23.

Source name:

World Development Indicators

Source organization:

United Nations Conference on Trade and Development, Handbook of Statistics and data files, and International Monetary Fund, International Financial Statistics.

Categories, topics:

Private Sector, Trade

Last updated:

apr 23, 2017

Indicators value changes by year

Meaning:
363.84
Minimum:
17.889
jan 1, 2004
Maximum:
1.795K
jan 1, 2015
At the date of observation
Value
Absolute change
Change from the previous value
jan 1, 1994
191.884
+191.884
0.0%
jan 1, 1995
342.84
+150.957
78.67%
jan 1, 1996
232.42
-110.42
-32.21%
jan 1, 1997
264.878
+32.458
13.97%
jan 1, 1998
153.506
-111.372
-42.05%
jan 1, 1999
75.925
-77.58
-50.54%
jan 1, 2000
55.888
-20.037
-26.39%
jan 1, 2001
100.0
+44.112
78.93%
jan 1, 2002
51.351
-48.649
-48.65%
jan 1, 2003
140.057
+88.705
172.74%
jan 1, 2004
17.889
-122.168
-87.23%
jan 1, 2005
30.568
+12.678
70.87%
jan 1, 2006
30.595
+0.027
0.09%
jan 1, 2007
33.162
+2.568
8.39%
jan 1, 2008
35.73
+2.568
7.74%
jan 1, 2009
30.27
-5.459
-15.28%
jan 1, 2010
29.73
-0.541
-1.79%
jan 1, 2011
35.135
+5.405
18.18%
jan 1, 2012
1.162K
+1.127K
3.21K%
jan 1, 2013
1.297K
+135.135
11.63%
jan 1, 2014
910.811
-386.486
-29.79%
jan 1, 2015
1.795K
+884.324
97.09%
jan 1, 2016
1.351K
-444.054
-24.74%

Ranking of countries by current statistics by years