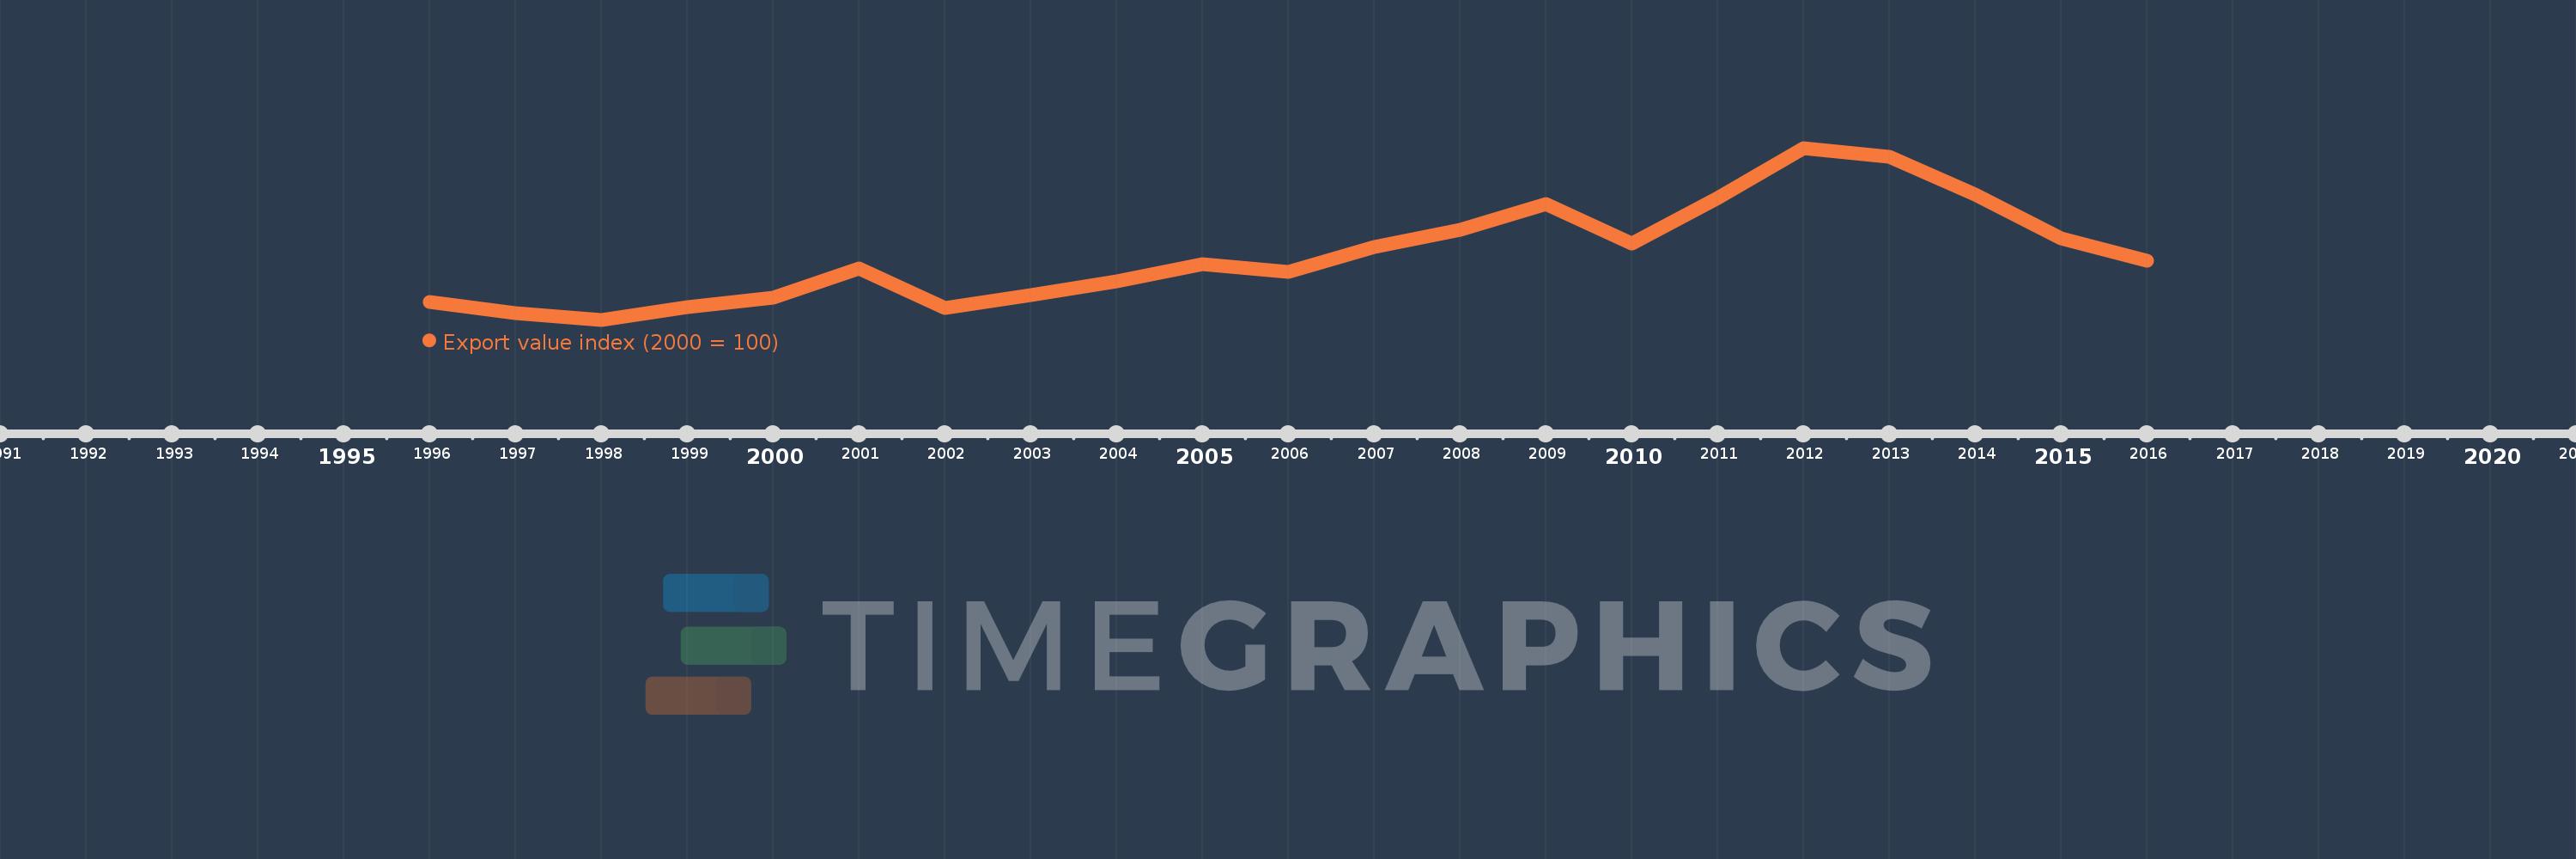
This timeline shows a graph from 1996 to 2016 of Malta. No data until 1995. Number of actual observations by date: 21.
Source name:
World Development Indicators
Source organization:
United Nations Conference on Trade and Development, Handbook of Statistics and data files, and International Monetary Fund, International Financial Statistics.
Categories, topics:
Private Sector, Trade
Last updated:
apr 23, 2017
Indicators value changes by year
Meaning:
108.972
Minimum:
66.442
jan 1, 1998
Maximum:
178.784
jan 1, 2012
At the date of observation
Value
Absolute change
Change from the previous value
jan 1, 1996
78.038
+78.038
0.0%
jan 1, 1997
70.579
-7.459
-9.56%
jan 1, 1998
66.442
-4.137
-5.86%
jan 1, 1999
74.755
+8.313
12.51%
jan 1, 2000
80.628
+5.873
7.86%
jan 1, 2001
100.0
+19.372
24.03%
jan 1, 2002
74.267
-25.733
-25.73%
jan 1, 2003
82.66
+8.393
11.3%
jan 1, 2004
91.821
+9.16
11.08%
jan 1, 2005
102.608
+10.788
11.75%
jan 1, 2006
97.794
-4.814
-4.69%
jan 1, 2007
113.965
+16.17
16.54%
jan 1, 2008
125.462
+11.497
10.09%
jan 1, 2009
141.925
+16.463
13.12%
jan 1, 2010
116.489
-25.435
-17.92%
jan 1, 2011
146.187
+29.698
25.49%
jan 1, 2012
178.784
+32.598
22.3%
jan 1, 2013
173.269
-5.516
-3.09%
jan 1, 2014
148.274
-24.995
-14.43%
jan 1, 2015
119.458
-28.816
-19.43%
jan 1, 2016
105.012
-14.446
-12.09%
Ranking of countries by current statistics by years