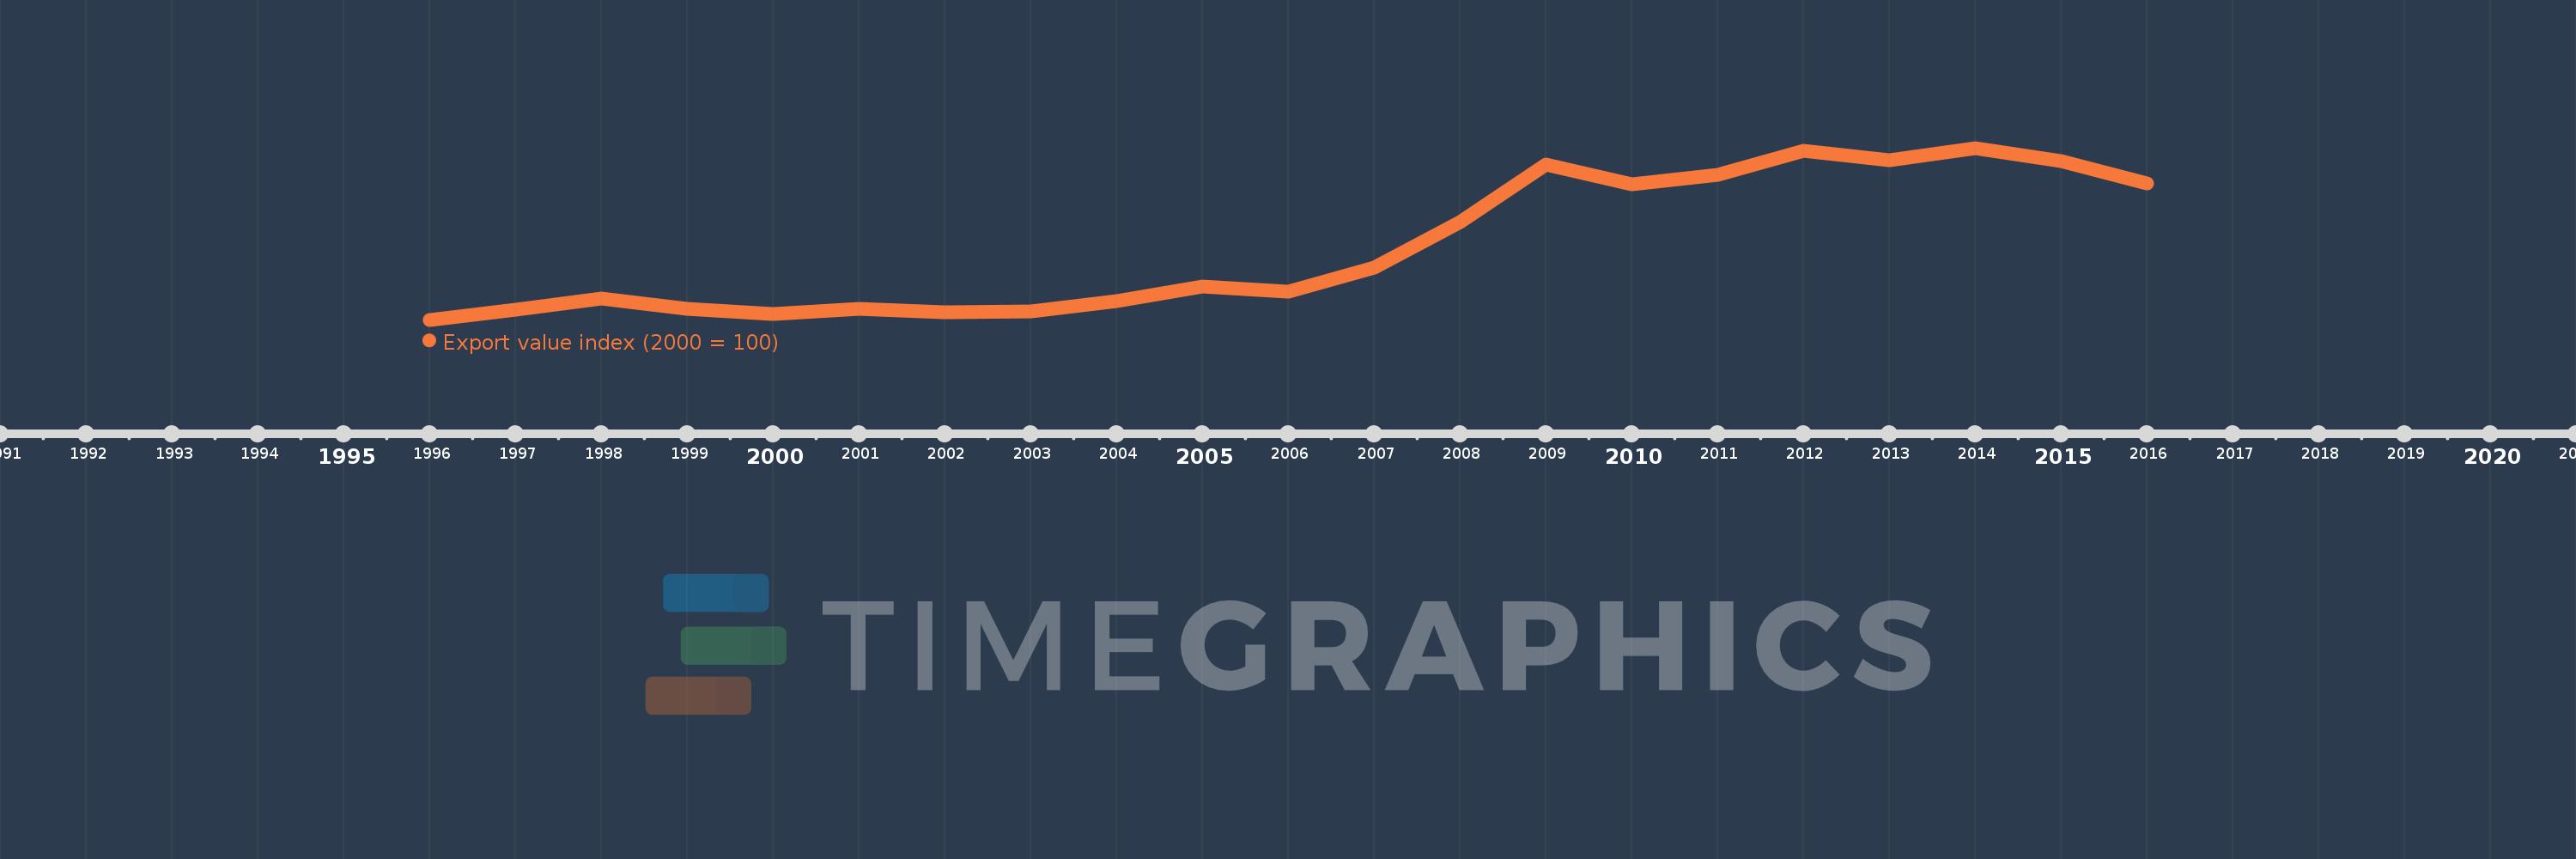
This timeline shows a graph from 1996 to 2016 of Kyrgyz Republic. No data until 1995. Number of actual observations by date: 21.
Source name:
World Development Indicators
Source organization:
United Nations Conference on Trade and Development, Handbook of Statistics and data files, and International Monetary Fund, International Financial Statistics.
Categories, topics:
Private Sector, Trade
Last updated:
apr 23, 2017
Indicators value changes by year
Meaning:
213.212
Minimum:
80.043
jan 1, 1996
Maximum:
392.836
jan 1, 2014
At the date of observation
Value
Absolute change
Change from the previous value
jan 1, 1996
80.043
+80.043
0.0%
jan 1, 1997
98.923
+18.88
23.59%
jan 1, 1998
118.185
+19.262
19.47%
jan 1, 1999
100.528
-17.656
-14.94%
jan 1, 2000
90.546
-9.982
-9.93%
jan 1, 2001
100.0
+9.454
10.44%
jan 1, 2002
93.169
-6.831
-6.83%
jan 1, 2003
95.028
+1.859
2.0%
jan 1, 2004
113.858
+18.83
19.81%
jan 1, 2005
140.693
+26.835
23.57%
jan 1, 2006
131.533
-9.16
-6.51%
jan 1, 2007
174.418
+42.885
32.6%
jan 1, 2008
258.583
+84.165
48.25%
jan 1, 2009
363.202
+104.619
40.46%
jan 1, 2010
327.461
-35.741
-9.84%
jan 1, 2011
343.688
+16.226
4.96%
jan 1, 2012
387.336
+43.648
12.7%
jan 1, 2013
370.679
-16.657
-4.3%
jan 1, 2014
392.836
+22.157
5.98%
jan 1, 2015
368.702
-24.134
-6.14%
jan 1, 2016
328.049
-40.654
-11.03%
Ranking of countries by current statistics by years