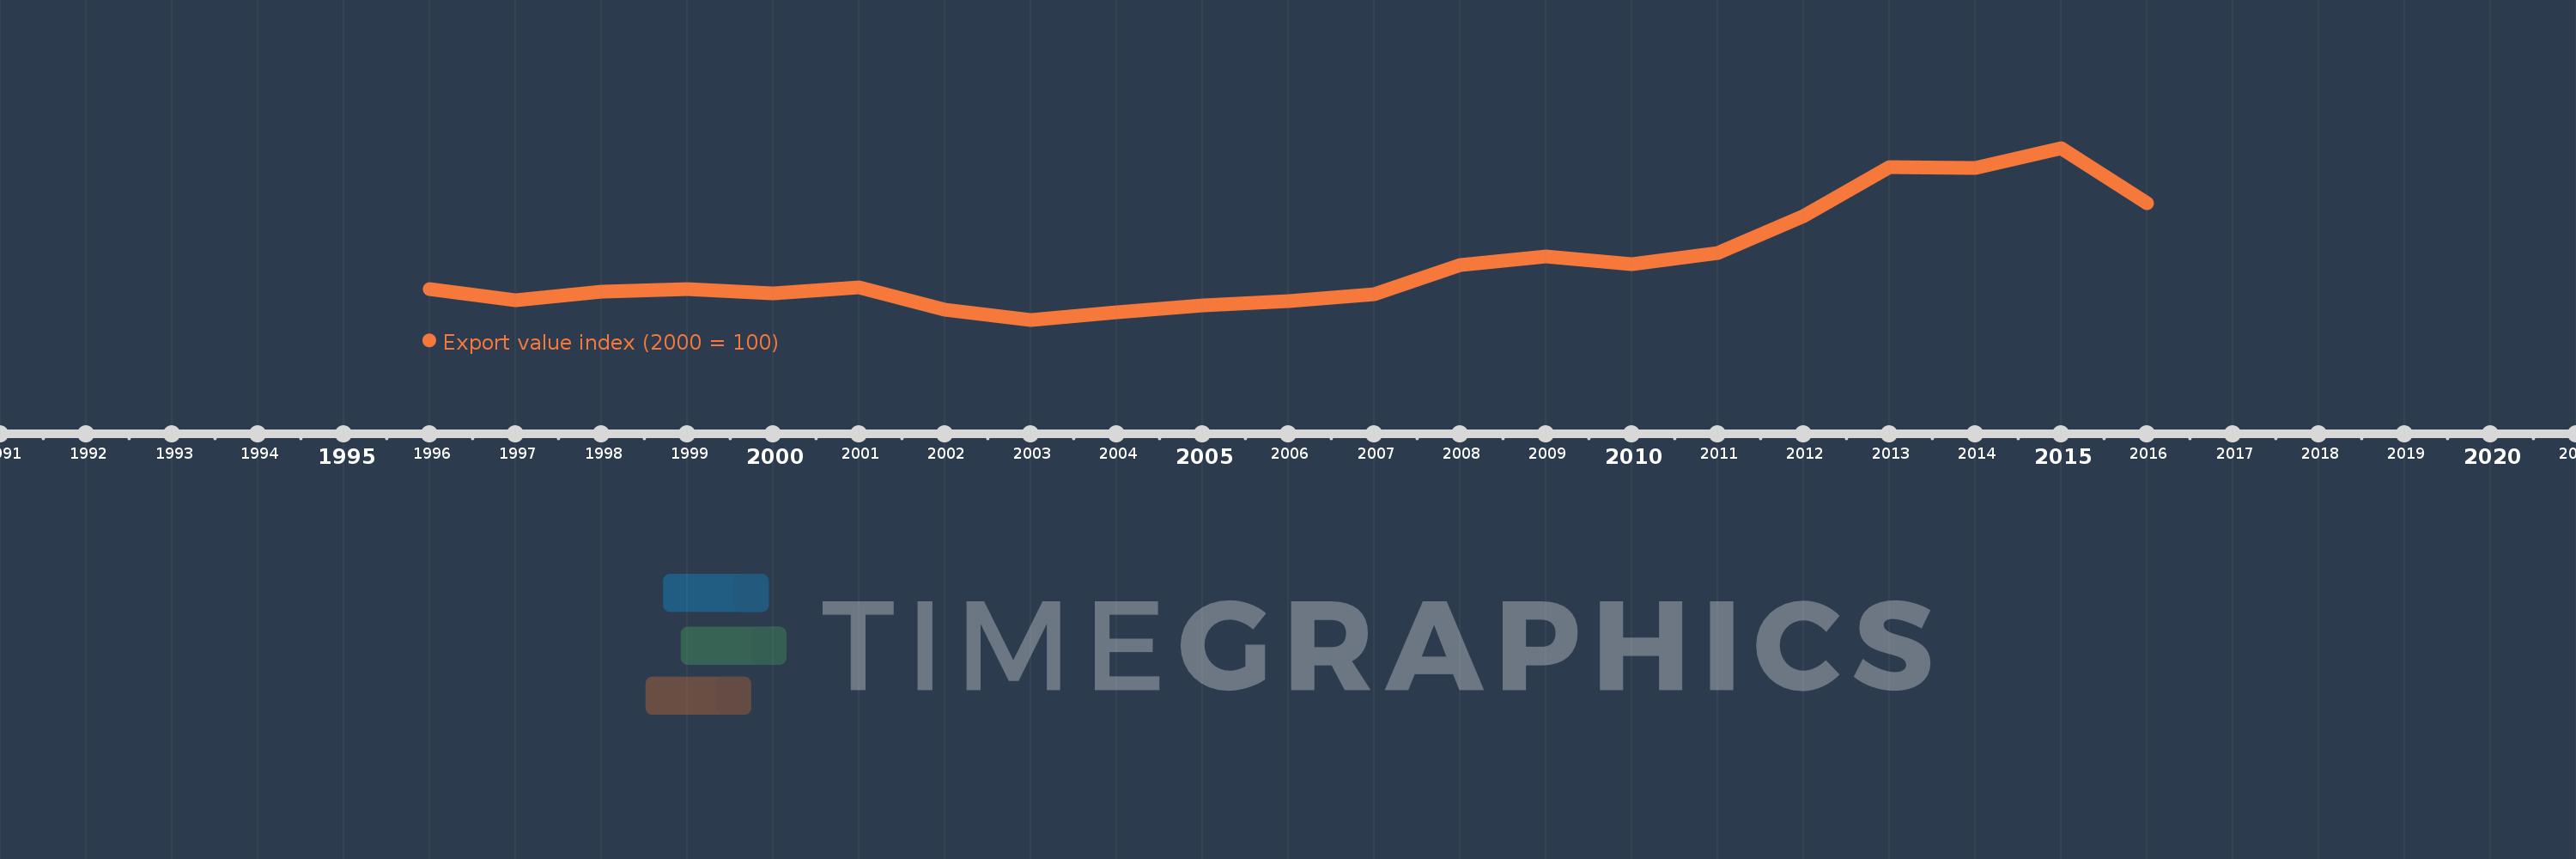
This timeline shows a graph from 1996 to 2016 of West Bank and Gaza. No data until 1995. Number of actual observations by date: 21.
Source name:
World Development Indicators
Source organization:
United Nations Conference on Trade and Development, Handbook of Statistics and data files, and International Monetary Fund, International Financial Statistics.
Categories, topics:
Private Sector, Trade
Last updated:
apr 23, 2017
Indicators value changes by year
Meaning:
130.188
Minimum:
60.088
jan 1, 2003
Maximum:
274.09
jan 1, 2015
At the date of observation
Value
Absolute change
Change from the previous value
jan 1, 1996
98.333
+98.333
0.0%
jan 1, 1997
84.685
-13.648
-13.88%
jan 1, 1998
95.401
+10.716
12.65%
jan 1, 1999
98.5
+3.099
3.25%
jan 1, 2000
92.838
-5.662
-5.75%
jan 1, 2001
100.0
+7.162
7.71%
jan 1, 2002
72.432
-27.568
-27.57%
jan 1, 2003
60.088
-12.344
-17.04%
jan 1, 2004
69.775
+9.687
16.12%
jan 1, 2005
78.005
+8.23
11.79%
jan 1, 2006
83.681
+5.677
7.28%
jan 1, 2007
91.481
+7.8
9.32%
jan 1, 2008
127.971
+36.49
39.89%
jan 1, 2009
139.313
+11.341
8.86%
jan 1, 2010
129.312
-10.001
-7.18%
jan 1, 2011
143.571
+14.259
11.03%
jan 1, 2012
189.344
+45.774
31.88%
jan 1, 2013
249.712
+60.367
31.88%
jan 1, 2014
249.614
-0.098
-0.04%
jan 1, 2015
274.09
+24.476
9.81%
jan 1, 2016
205.804
-68.285
-24.91%
Ranking of countries by current statistics by years