33
/
AIzaSyAYiBZKx7MnpbEhh9jyipgxe19OcubqV5w
May 1, 2025
118851
Denmark
DNK
true
2
1
Export value index (2000 = 100)
2016,2015,2014,2013,2012,2011,2010,2009,2008,2007,2006,2005,2004,2003,2002,2001,2000,1999,1998,1997,1996
Download
Global statistics library →Denmark →

Export value index (2000 = 100)

This statistics in other country:

AfghanistanAlbaniaAlgeriaAmerican SamoaAndorraAngolaAntigua and BarbudaArgentinaArmeniaArubaAustraliaAustriaAzerbaijanBahamas, TheBahrainBangladeshBarbadosBelarusBelgiumBelizeBeninBermudaBhutanBoliviaBosnia and HerzegovinaBotswanaBrazilBritish Virgin IslandsBrunei DarussalamBulgariaBurkina FasoBurundiCabo VerdeCambodiaCameroonCanadaCayman IslandsCentral African RepublicChadChileChinaColombiaComorosCongo, Dem. Rep.Congo, Rep.Costa RicaCote d'IvoireCroatiaCubaCuracaoCyprusCzech RepublicDenmarkDjiboutiDominicaDominican RepublicEcuadorEgypt, Arab Rep.El SalvadorEquatorial GuineaEritreaEstoniaEthiopiaFaroe IslandsFijiFinlandFranceFrench PolynesiaGabonGambia, TheGeorgiaGermanyGhanaGibraltarGreeceGreenlandGrenadaGuamGuatemalaGuineaGuinea-BissauGuyanaHaitiHondurasHong Kong SAR, ChinaHungaryIcelandIndiaIndonesiaIran, Islamic Rep.IraqIrelandIsraelItalyJamaicaJapanJordanKazakhstanKenyaKiribatiKorea, Dem. People’s Rep.Korea, Rep.KuwaitKyrgyz RepublicLao PDRLatviaLebanonLesothoLiberiaLibyaLithuaniaLuxembourgMacao SAR, ChinaMacedonia, FYRMadagascarMalawiMalaysiaMaldivesMaliMaltaMarshall IslandsMauritaniaMauritiusMexicoMicronesia, Fed. Sts.MoldovaMongoliaMoroccoMozambiqueMyanmarNamibiaNauruNepalNetherlandsNew CaledoniaNew ZealandNicaraguaNigerNigeriaNorthern Mariana IslandsNorwayOmanPakistanPalauPanamaPapua New GuineaParaguayPeruPhilippinesPolandPortugalQatarRomaniaRussian FederationRwandaSamoaSao Tome and PrincipeSaudi ArabiaSenegalSerbiaSeychellesSierra LeoneSingaporeSlovak RepublicSloveniaSolomon IslandsSomaliaSouth AfricaSpainSri LankaSt. Kitts and NevisSt. LuciaSt. Vincent and the GrenadinesSudanSurinameSwazilandSwedenSwitzerlandSyrian Arab RepublicTajikistanTanzaniaThailandTogoTongaTrinidad and TobagoTunisiaTurkeyTurkmenistanTurks and Caicos IslandsUgandaUkraineUnited Arab EmiratesUnited KingdomUnited StatesUruguayUzbekistanVanuatuVenezuela, RBVietnamWest Bank and GazaYemen, Rep.ZambiaZimbabwe

Timeline:

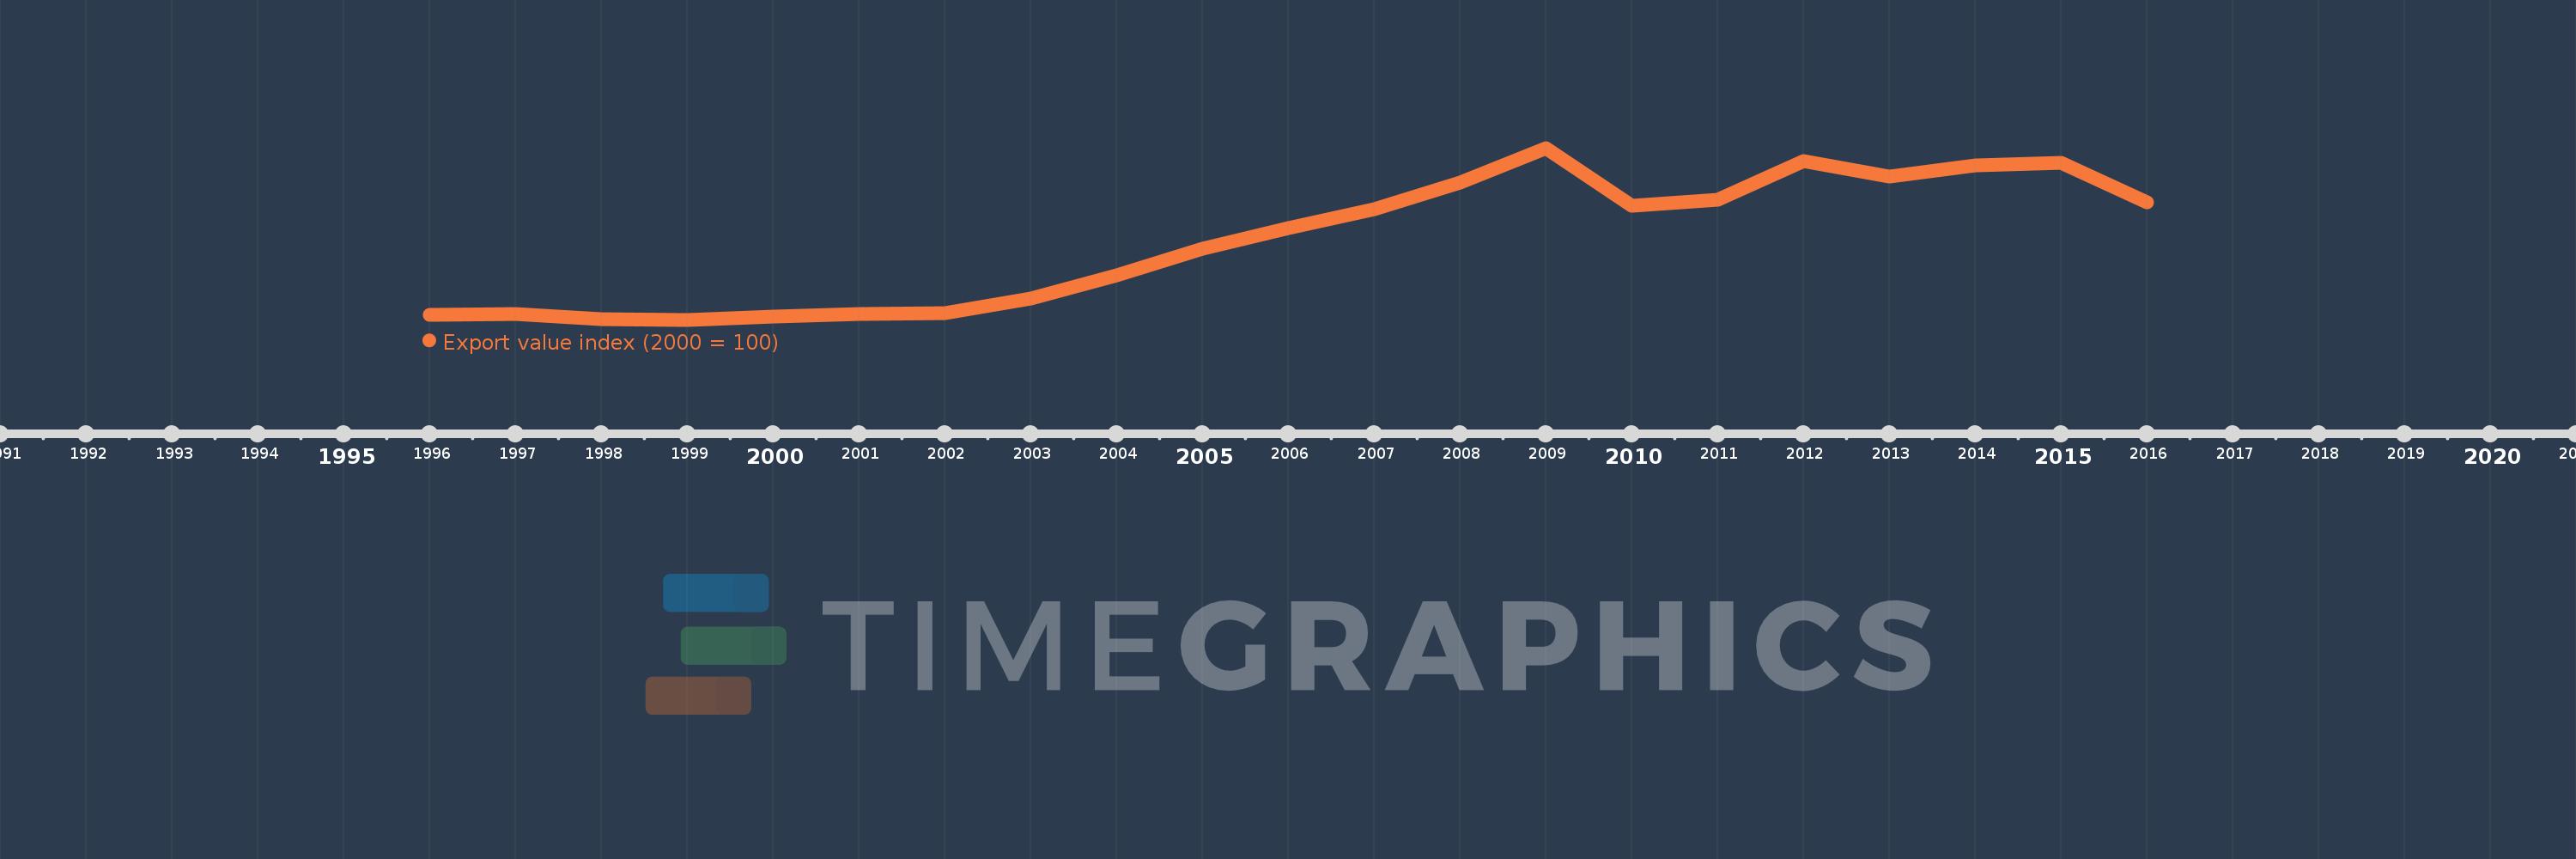
This timeline shows a graph from 1996 to 2016 of Denmark. No data until 1995. Number of actual observations by date: 21.

Source name:

World Development Indicators

Source organization:

United Nations Conference on Trade and Development, Handbook of Statistics and data files, and International Monetary Fund, International Financial Statistics.

Categories, topics:

Private Sector, Trade

Last updated:

apr 23, 2017

Indicators value changes by year

Meaning:
156.039
Minimum:
95.701
jan 1, 1999
Maximum:
228.517
jan 1, 2009
At the date of observation
Value
Absolute change
Change from the previous value
jan 1, 1996
99.503
+99.503
0.0%
jan 1, 1997
100.343
+0.841
0.84%
jan 1, 1998
96.308
-4.035
-4.02%
jan 1, 1999
95.701
-0.606
-0.63%
jan 1, 2000
98.392
+2.691
2.81%
jan 1, 2001
100.0
+1.608
1.63%
jan 1, 2002
101.054
+1.054
1.05%
jan 1, 2003
112.37
+11.316
11.2%
jan 1, 2004
129.994
+17.624
15.68%
jan 1, 2005
150.646
+20.653
15.89%
jan 1, 2006
166.363
+15.716
10.43%
jan 1, 2007
180.898
+14.535
8.74%
jan 1, 2008
201.641
+20.743
11.47%
jan 1, 2009
228.517
+26.876
13.33%
jan 1, 2010
183.685
-44.832
-19.62%
jan 1, 2011
188.486
+4.801
2.61%
jan 1, 2012
218.63
+30.145
15.99%
jan 1, 2013
206.132
-12.498
-5.72%
jan 1, 2014
215.196
+9.064
4.4%
jan 1, 2015
216.722
+1.526
0.71%
jan 1, 2016
186.243
-30.479
-14.06%

Ranking of countries by current statistics by years