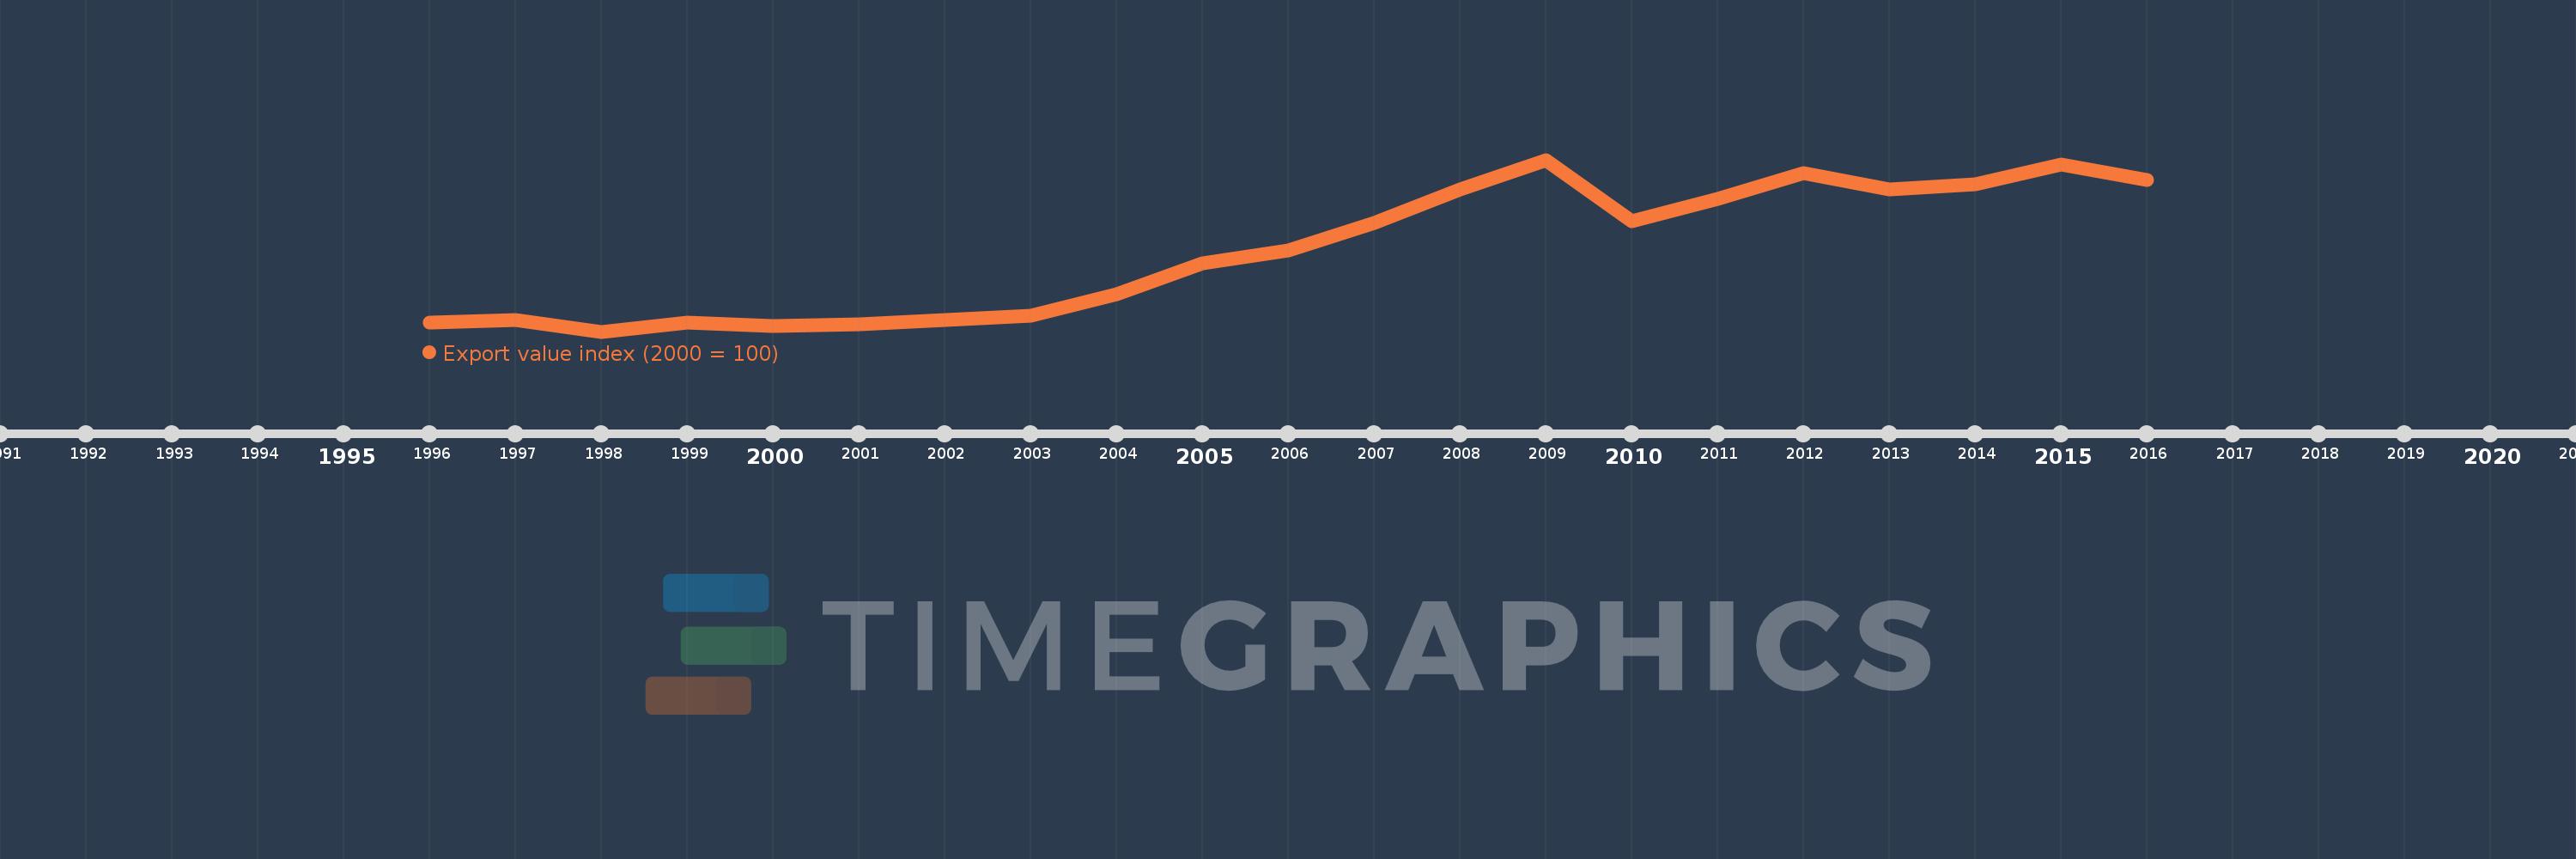
This timeline shows a graph from 1996 to 2016 of Croatia. No data until 1995. Number of actual observations by date: 21.
Source name:
World Development Indicators
Source organization:
United Nations Conference on Trade and Development, Handbook of Statistics and data files, and International Monetary Fund, International Financial Statistics.
Categories, topics:
Private Sector, Trade
Last updated:
apr 23, 2017
Indicators value changes by year
Meaning:
196.863
Minimum:
89.84
jan 1, 1998
Maximum:
318.434
jan 1, 2009
At the date of observation
Value
Absolute change
Change from the previous value
jan 1, 1996
101.933
+101.933
0.0%
jan 1, 1997
104.781
+2.849
2.79%
jan 1, 1998
89.84
-14.942
-14.26%
jan 1, 1999
101.931
+12.092
13.46%
jan 1, 2000
97.087
-4.845
-4.75%
jan 1, 2001
100.0
+2.913
3.0%
jan 1, 2002
105.289
+5.289
5.29%
jan 1, 2003
110.65
+5.361
5.09%
jan 1, 2004
139.603
+28.952
26.17%
jan 1, 2005
181.067
+41.464
29.7%
jan 1, 2006
197.965
+16.898
9.33%
jan 1, 2007
234.159
+36.195
18.28%
jan 1, 2008
279.003
+44.844
19.15%
jan 1, 2009
318.434
+39.43
14.13%
jan 1, 2010
236.344
-82.09
-25.78%
jan 1, 2011
266.398
+30.054
12.72%
jan 1, 2012
300.983
+34.585
12.98%
jan 1, 2013
279.15
-21.833
-7.25%
jan 1, 2014
285.642
+6.492
2.33%
jan 1, 2015
312.705
+27.063
9.47%
jan 1, 2016
291.15
-21.555
-6.89%
Ranking of countries by current statistics by years