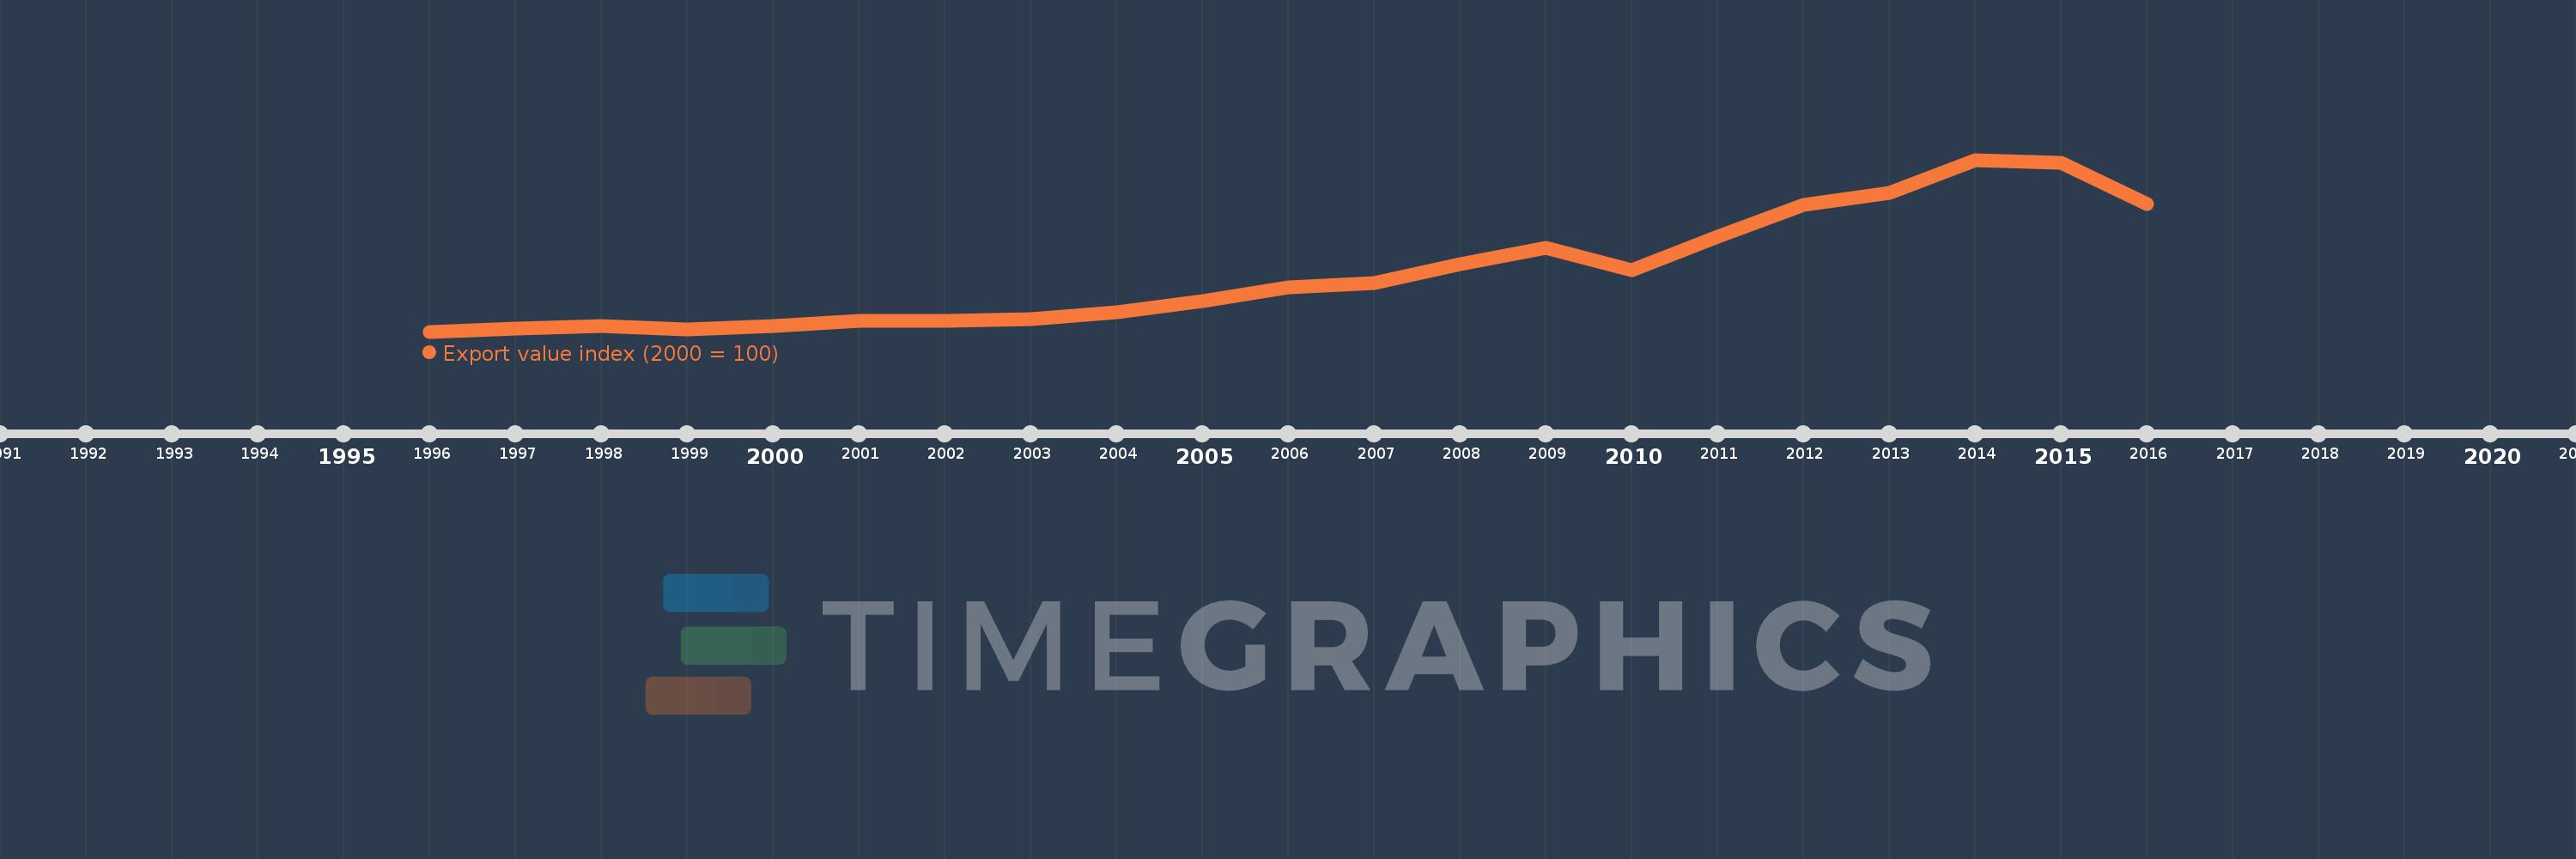
This timeline shows a graph from 1996 to 2016 of Georgia. No data until 1995. Number of actual observations by date: 21.
Source name:
World Development Indicators
Source organization:
United Nations Conference on Trade and Development, Handbook of Statistics and data files, and International Monetary Fund, International Financial Statistics.
Categories, topics:
Private Sector, Trade
Last updated:
apr 23, 2017
Indicators value changes by year
Meaning:
338.981
Minimum:
46.749
jan 1, 1996
Maximum:
900.929
jan 1, 2014
At the date of observation
Value
Absolute change
Change from the previous value
jan 1, 1996
46.749
+46.749
0.0%
jan 1, 1997
61.61
+14.861
31.79%
jan 1, 1998
74.303
+12.693
20.6%
jan 1, 1999
59.133
-15.17
-20.42%
jan 1, 2000
73.684
+14.551
24.61%
jan 1, 2001
100.0
+26.316
35.71%
jan 1, 2002
98.452
-1.548
-1.55%
jan 1, 2003
107.121
+8.669
8.81%
jan 1, 2004
142.724
+35.604
33.24%
jan 1, 2005
200.28
+57.555
40.33%
jan 1, 2006
267.802
+67.522
33.71%
jan 1, 2007
289.837
+22.035
8.23%
jan 1, 2008
381.455
+91.619
31.61%
jan 1, 2009
462.941
+81.486
21.36%
jan 1, 2010
350.96
-111.981
-24.19%
jan 1, 2011
519.195
+168.235
47.94%
jan 1, 2012
677.709
+158.514
30.53%
jan 1, 2013
735.604
+57.895
8.54%
jan 1, 2014
900.929
+165.325
22.47%
jan 1, 2015
885.759
-15.17
-1.68%
jan 1, 2016
682.353
-203.406
-22.96%
Ranking of countries by current statistics by years