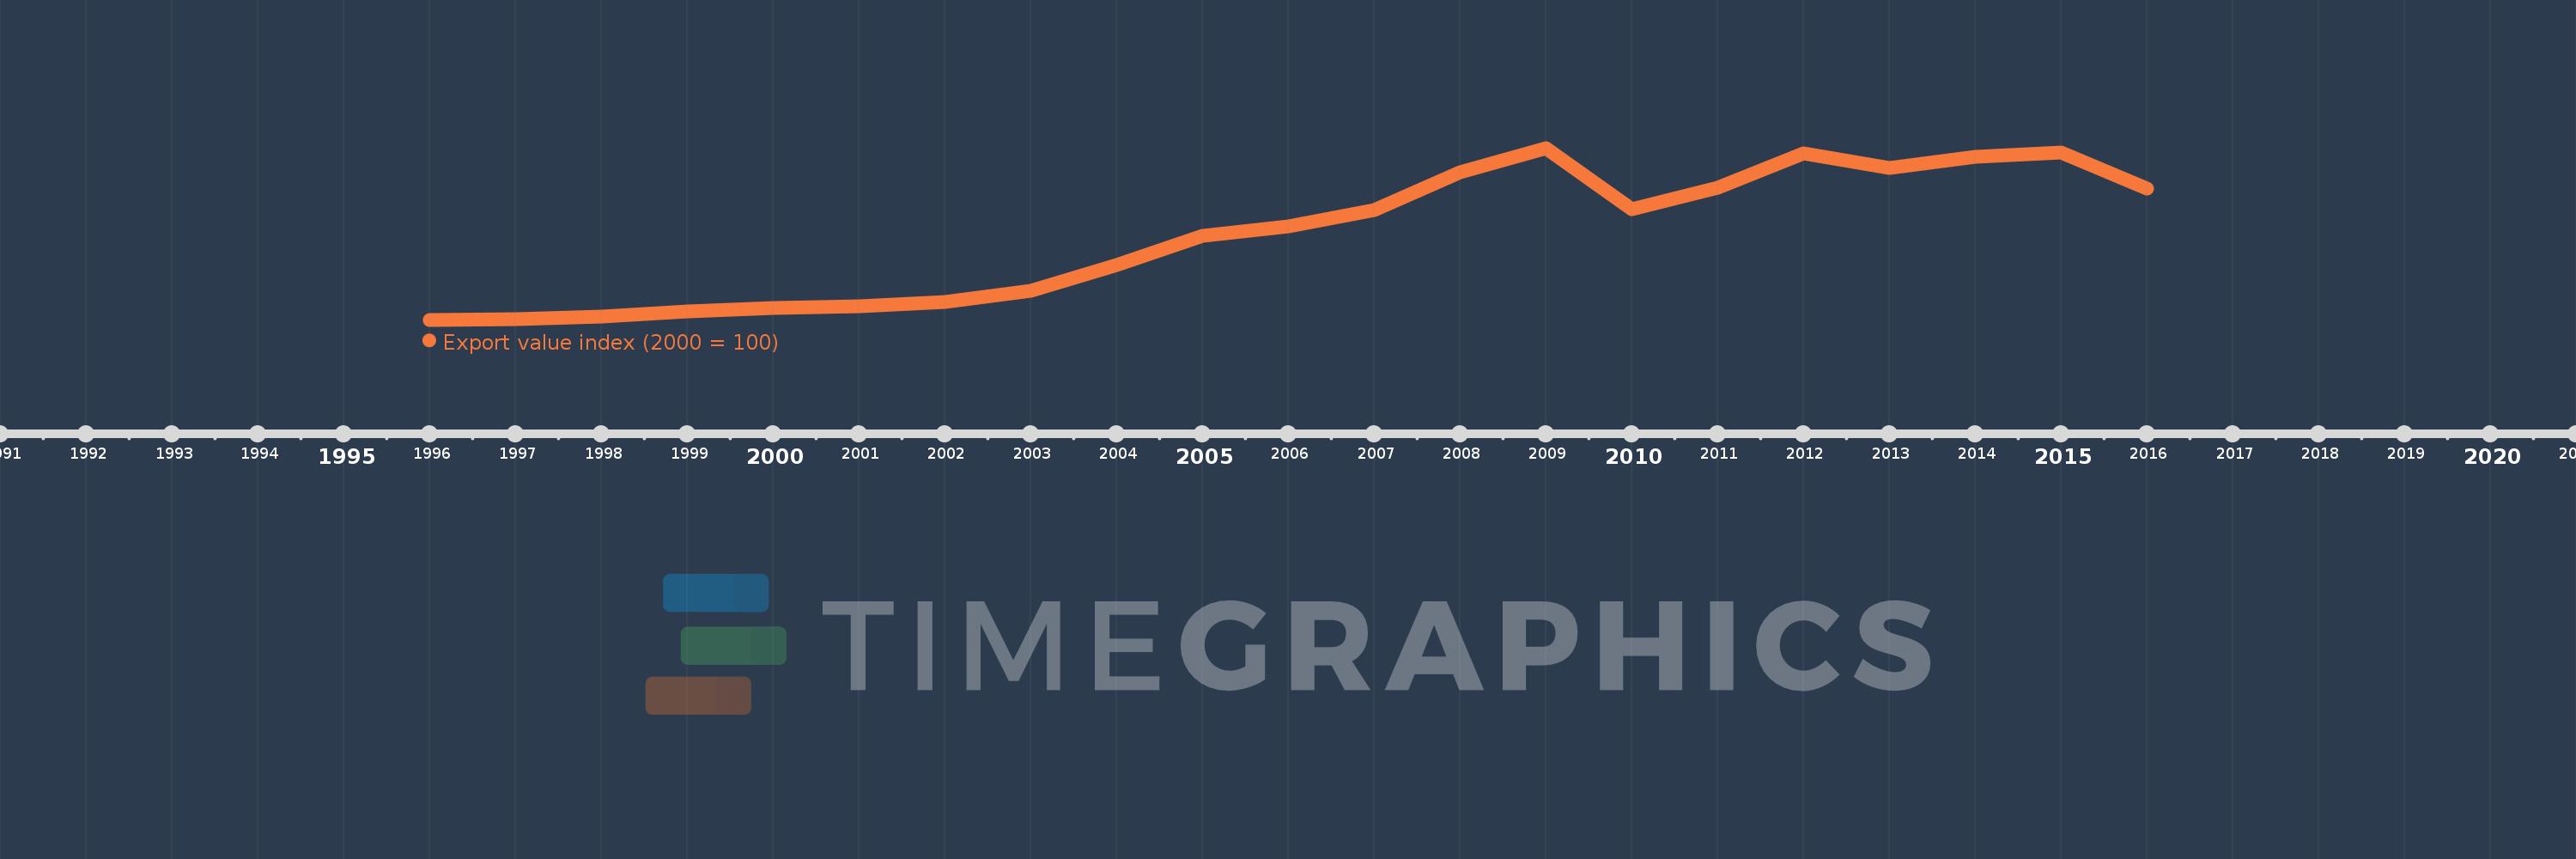
This timeline shows a graph from 1996 to 2016 of Austria. No data until 1995. Number of actual observations by date: 21.
Source name:
World Development Indicators
Source organization:
United Nations Conference on Trade and Development, Handbook of Statistics and data files, and International Monetary Fund, International Financial Statistics.
Categories, topics:
Private Sector, Trade
Last updated:
apr 23, 2017
Indicators value changes by year
Meaning:
175.159
Minimum:
85.485
jan 1, 1996
Maximum:
268.404
jan 1, 2009
At the date of observation
Value
Absolute change
Change from the previous value
jan 1, 1996
85.485
+85.485
0.0%
jan 1, 1997
86.075
+0.59
0.69%
jan 1, 1998
88.521
+2.446
2.84%
jan 1, 1999
94.782
+6.262
7.07%
jan 1, 2000
97.897
+3.115
3.29%
jan 1, 2001
100.0
+2.103
2.15%
jan 1, 2002
104.749
+4.749
4.75%
jan 1, 2003
116.478
+11.729
11.2%
jan 1, 2004
143.828
+27.35
23.48%
jan 1, 2005
175.259
+31.431
21.85%
jan 1, 2006
185.336
+10.077
5.75%
jan 1, 2007
202.465
+17.129
9.24%
jan 1, 2008
242.245
+39.781
19.65%
jan 1, 2009
268.404
+26.159
10.8%
jan 1, 2010
202.816
-65.588
-24.44%
jan 1, 2011
225.869
+23.053
11.37%
jan 1, 2012
262.687
+36.818
16.3%
jan 1, 2013
246.673
-16.014
-6.1%
jan 1, 2014
259.324
+12.651
5.13%
jan 1, 2015
263.902
+4.578
1.77%
jan 1, 2016
225.537
-38.365
-14.54%
Ranking of countries by current statistics by years