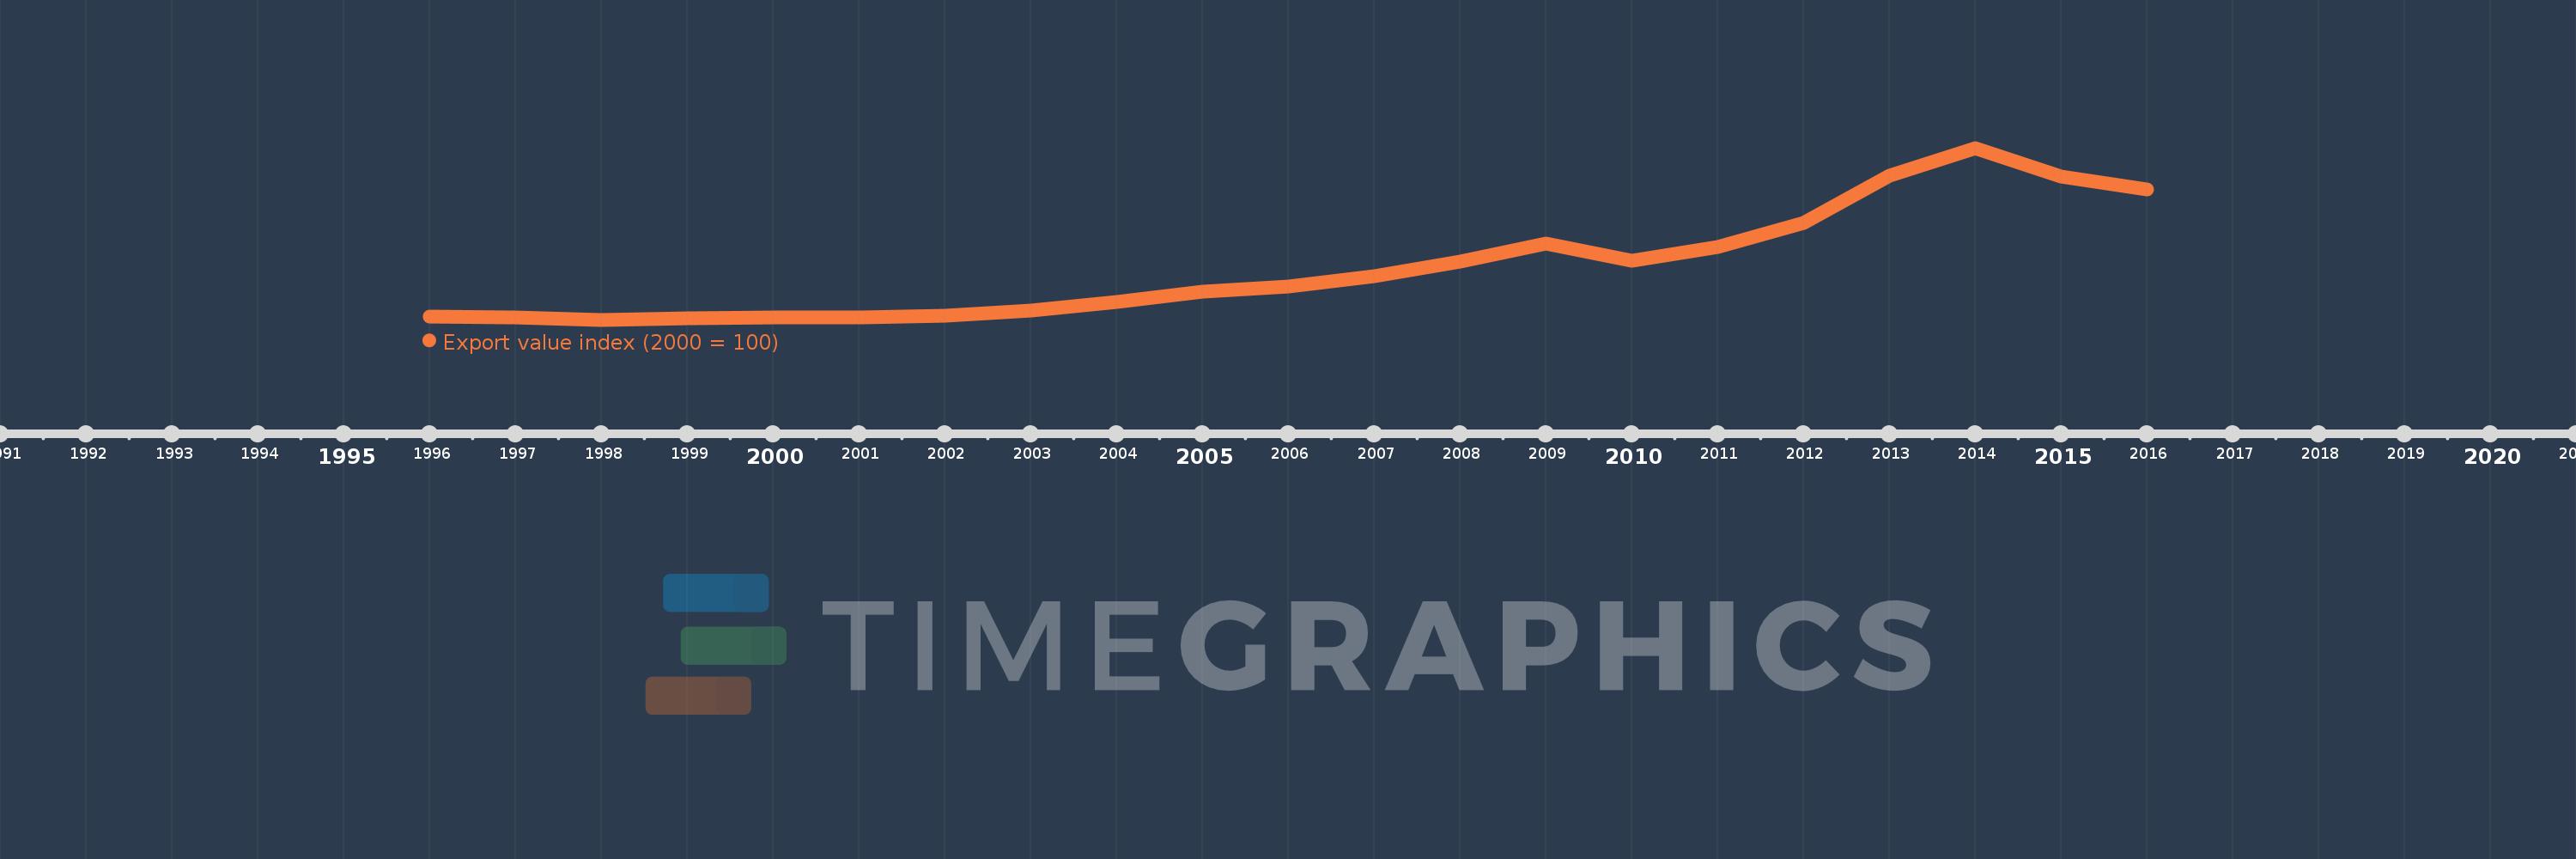
This timeline shows a graph from 1996 to 2016 of Switzerland. No data until 1995. Number of actual observations by date: 21.
Source name:
World Development Indicators
Source organization:
United Nations Conference on Trade and Development, Handbook of Statistics and data files, and International Monetary Fund, International Financial Statistics.
Categories, topics:
Private Sector, Trade
Last updated:
apr 23, 2017
Indicators value changes by year
Meaning:
201.397
Minimum:
94.596
jan 1, 1998
Maximum:
444.535
jan 1, 2014
At the date of observation
Value
Absolute change
Change from the previous value
jan 1, 1996
101.418
+101.418
0.0%
jan 1, 1997
99.065
-2.353
-2.32%
jan 1, 1998
94.596
-4.468
-4.51%
jan 1, 1999
97.957
+3.361
3.55%
jan 1, 2000
99.751
+1.794
1.83%
jan 1, 2001
100.0
+0.249
0.25%
jan 1, 2002
102.042
+2.042
2.04%
jan 1, 2003
113.912
+11.87
11.63%
jan 1, 2004
130.214
+16.302
14.31%
jan 1, 2005
152.601
+22.388
17.19%
jan 1, 2006
162.646
+10.044
6.58%
jan 1, 2007
183.672
+21.027
12.93%
jan 1, 2008
213.762
+30.089
16.38%
jan 1, 2009
249.39
+35.628
16.67%
jan 1, 2010
214.254
-35.136
-14.09%
jan 1, 2011
242.993
+28.739
13.41%
jan 1, 2012
291.701
+48.708
20.05%
jan 1, 2013
388.154
+96.453
33.07%
jan 1, 2014
444.535
+56.381
14.53%
jan 1, 2015
386.588
-57.947
-13.04%
jan 1, 2016
360.091
-26.497
-6.85%
Ranking of countries by current statistics by years