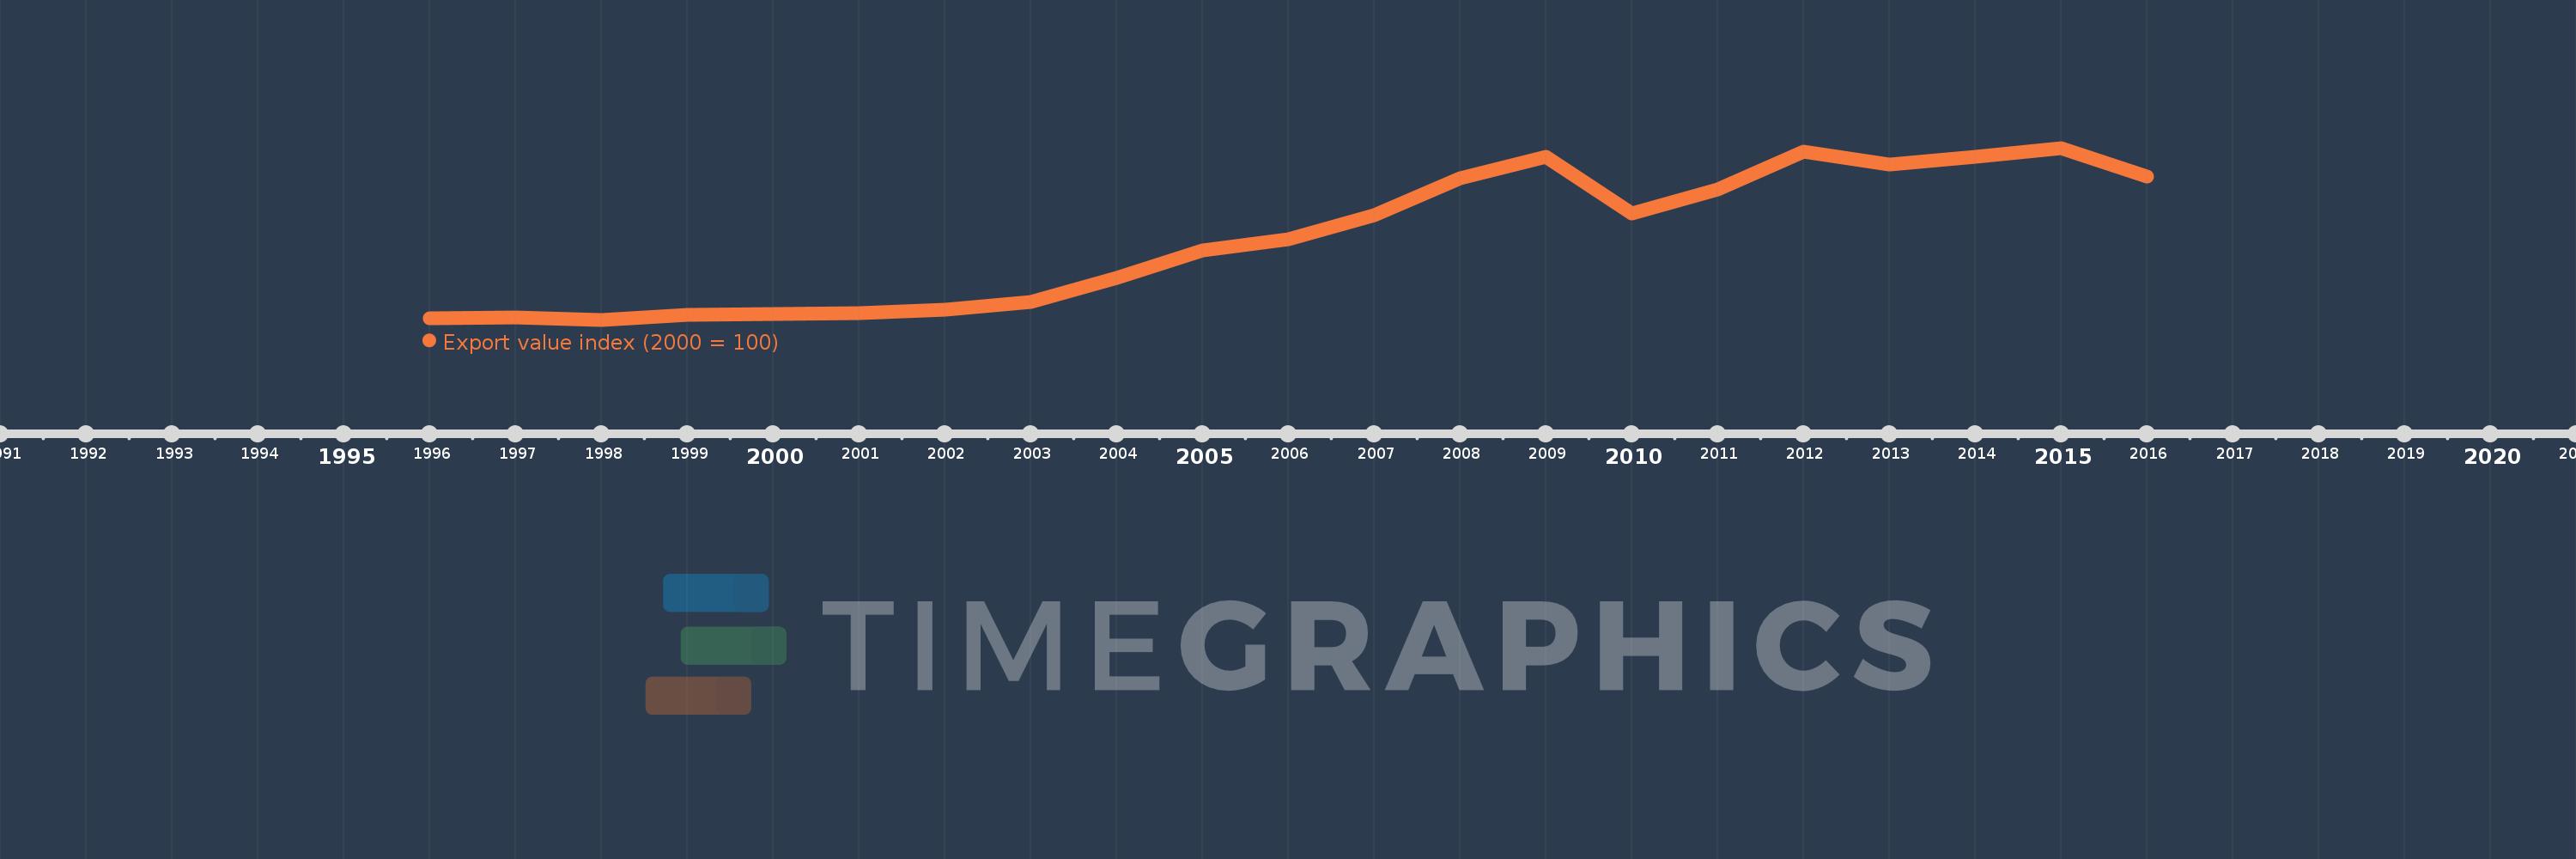
This timeline shows a graph from 1996 to 2016 of Germany. No data until 1995. Number of actual observations by date: 21.
Source name:
World Development Indicators
Source organization:
United Nations Conference on Trade and Development, Handbook of Statistics and data files, and International Monetary Fund, International Financial Statistics.
Categories, topics:
Private Sector, Trade
Last updated:
apr 23, 2017
Indicators value changes by year
Meaning:
176.623
Minimum:
93.182
jan 1, 1998
Maximum:
271.526
jan 1, 2015
At the date of observation
Value
Absolute change
Change from the previous value
jan 1, 1996
95.105
+95.105
0.0%
jan 1, 1997
95.182
+0.077
0.08%
jan 1, 1998
93.182
-1.999
-2.1%
jan 1, 1999
98.687
+5.505
5.91%
jan 1, 2000
98.838
+0.15
0.15%
jan 1, 2001
100.0
+1.162
1.18%
jan 1, 2002
103.851
+3.851
3.85%
jan 1, 2003
111.878
+8.027
7.73%
jan 1, 2004
136.536
+24.658
22.04%
jan 1, 2005
165.3
+28.763
21.07%
jan 1, 2006
176.386
+11.087
6.71%
jan 1, 2007
201.31
+24.924
14.13%
jan 1, 2008
240.026
+38.715
19.23%
jan 1, 2009
262.727
+22.701
9.46%
jan 1, 2010
203.478
-59.248
-22.55%
jan 1, 2011
228.709
+25.231
12.4%
jan 1, 2012
267.78
+39.07
17.08%
jan 1, 2013
254.541
-13.239
-4.94%
jan 1, 2014
262.526
+7.985
3.14%
jan 1, 2015
271.526
+9.0
3.43%
jan 1, 2016
241.525
-30.001
-11.05%
Ranking of countries by current statistics by years