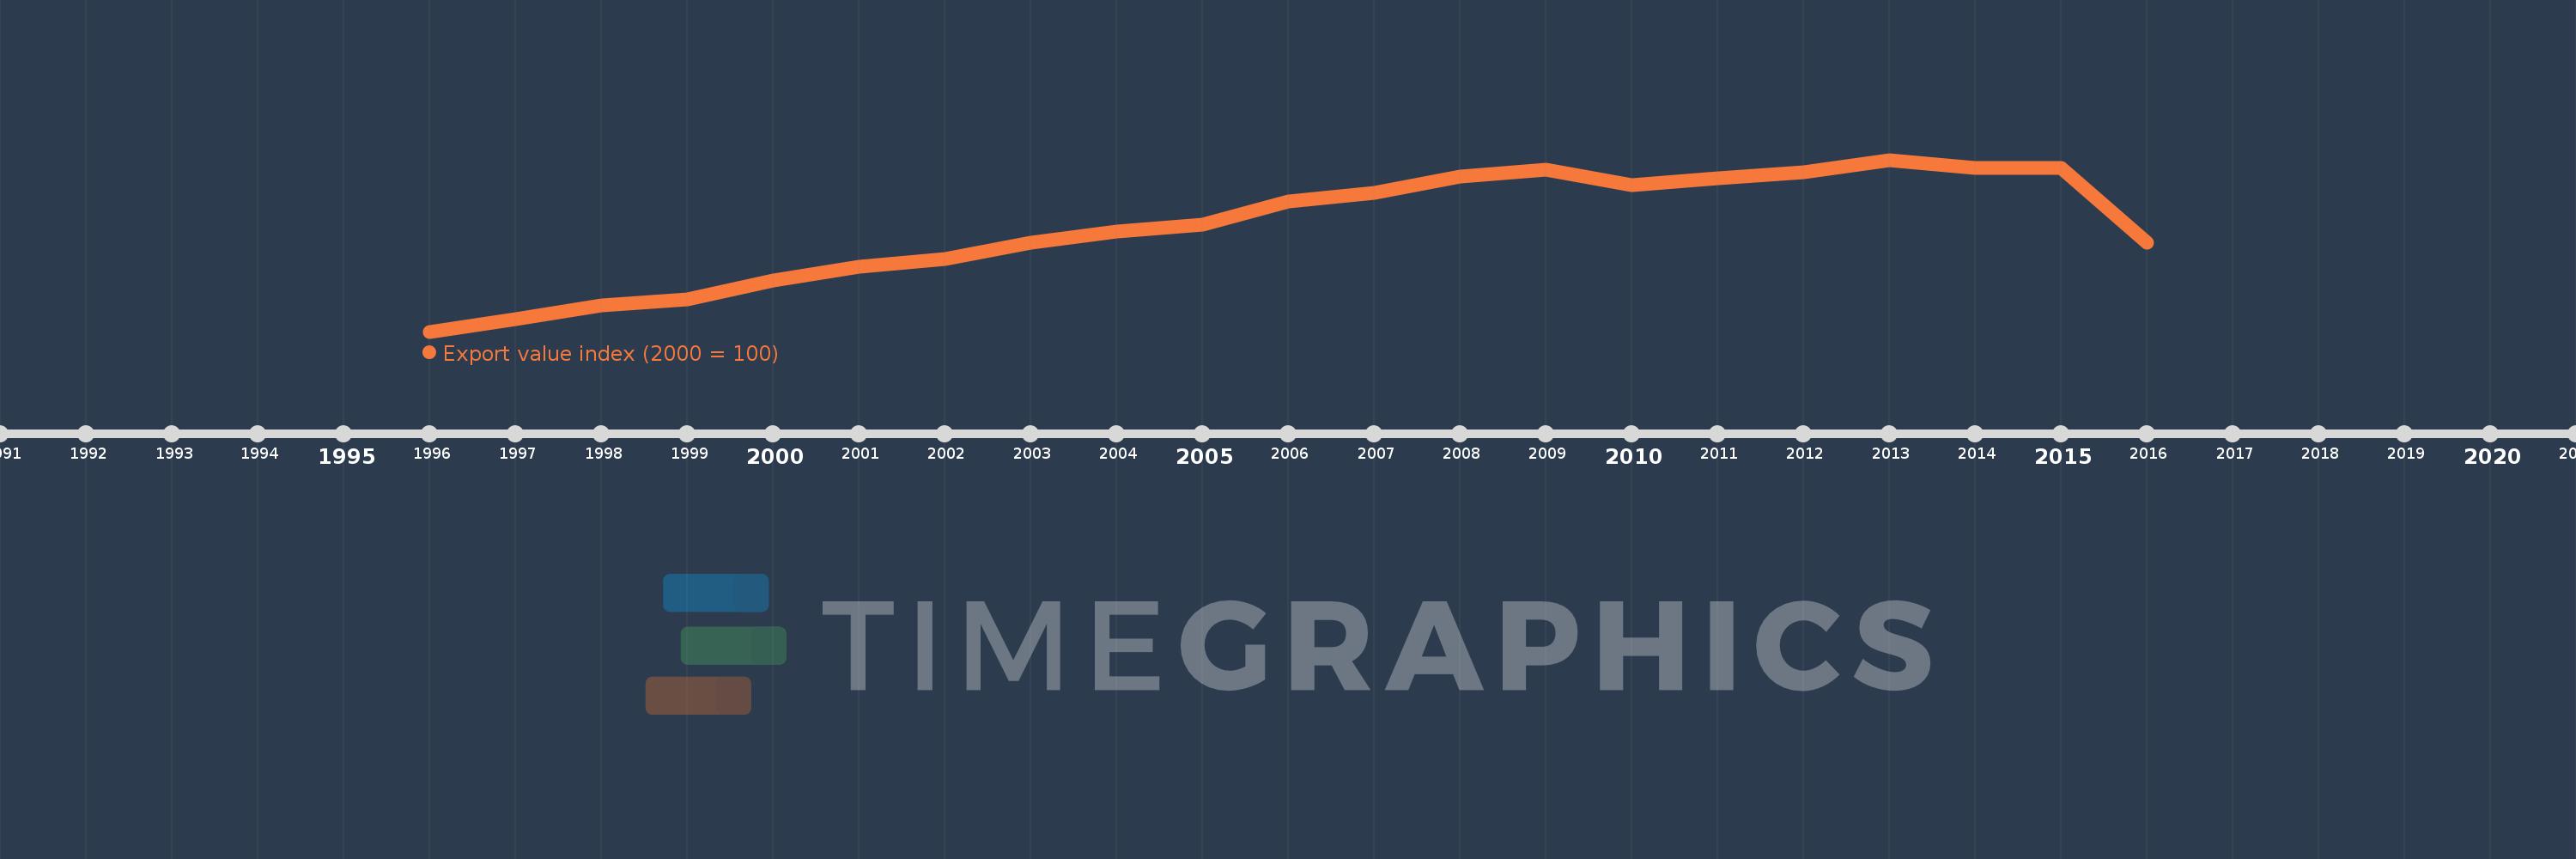
This timeline shows a graph from 1996 to 2016 of British Virgin Islands. No data until 1995. Number of actual observations by date: 21.
Source name:
World Development Indicators
Source organization:
United Nations Conference on Trade and Development, Handbook of Statistics and data files, and International Monetary Fund, International Financial Statistics.
Categories, topics:
Private Sector, Trade
Last updated:
apr 23, 2017
Indicators value changes by year
Meaning:
117.848
Minimum:
71.111
jan 1, 1996
Maximum:
148.148
jan 1, 2013
At the date of observation
Value
Absolute change
Change from the previous value
jan 1, 1996
71.111
+71.111
0.0%
jan 1, 1997
76.667
+5.556
7.81%
jan 1, 1998
82.963
+6.296
8.21%
jan 1, 1999
85.556
+2.593
3.13%
jan 1, 2000
94.074
+8.519
9.96%
jan 1, 2001
100.0
+5.926
6.3%
jan 1, 2002
103.704
+3.704
3.7%
jan 1, 2003
111.111
+7.407
7.14%
jan 1, 2004
115.926
+4.815
4.33%
jan 1, 2005
118.889
+2.963
2.56%
jan 1, 2006
129.63
+10.741
9.03%
jan 1, 2007
133.333
+3.704
2.86%
jan 1, 2008
140.741
+7.407
5.56%
jan 1, 2009
143.704
+2.963
2.11%
jan 1, 2010
136.667
-7.037
-4.9%
jan 1, 2011
140.0
+3.333
2.44%
jan 1, 2012
142.593
+2.593
1.85%
jan 1, 2013
148.148
+5.556
3.9%
jan 1, 2014
144.444
-3.704
-2.5%
jan 1, 2015
144.444
0.0
0.0%
jan 1, 2016
111.111
-33.333
-23.08%
Ranking of countries by current statistics by years