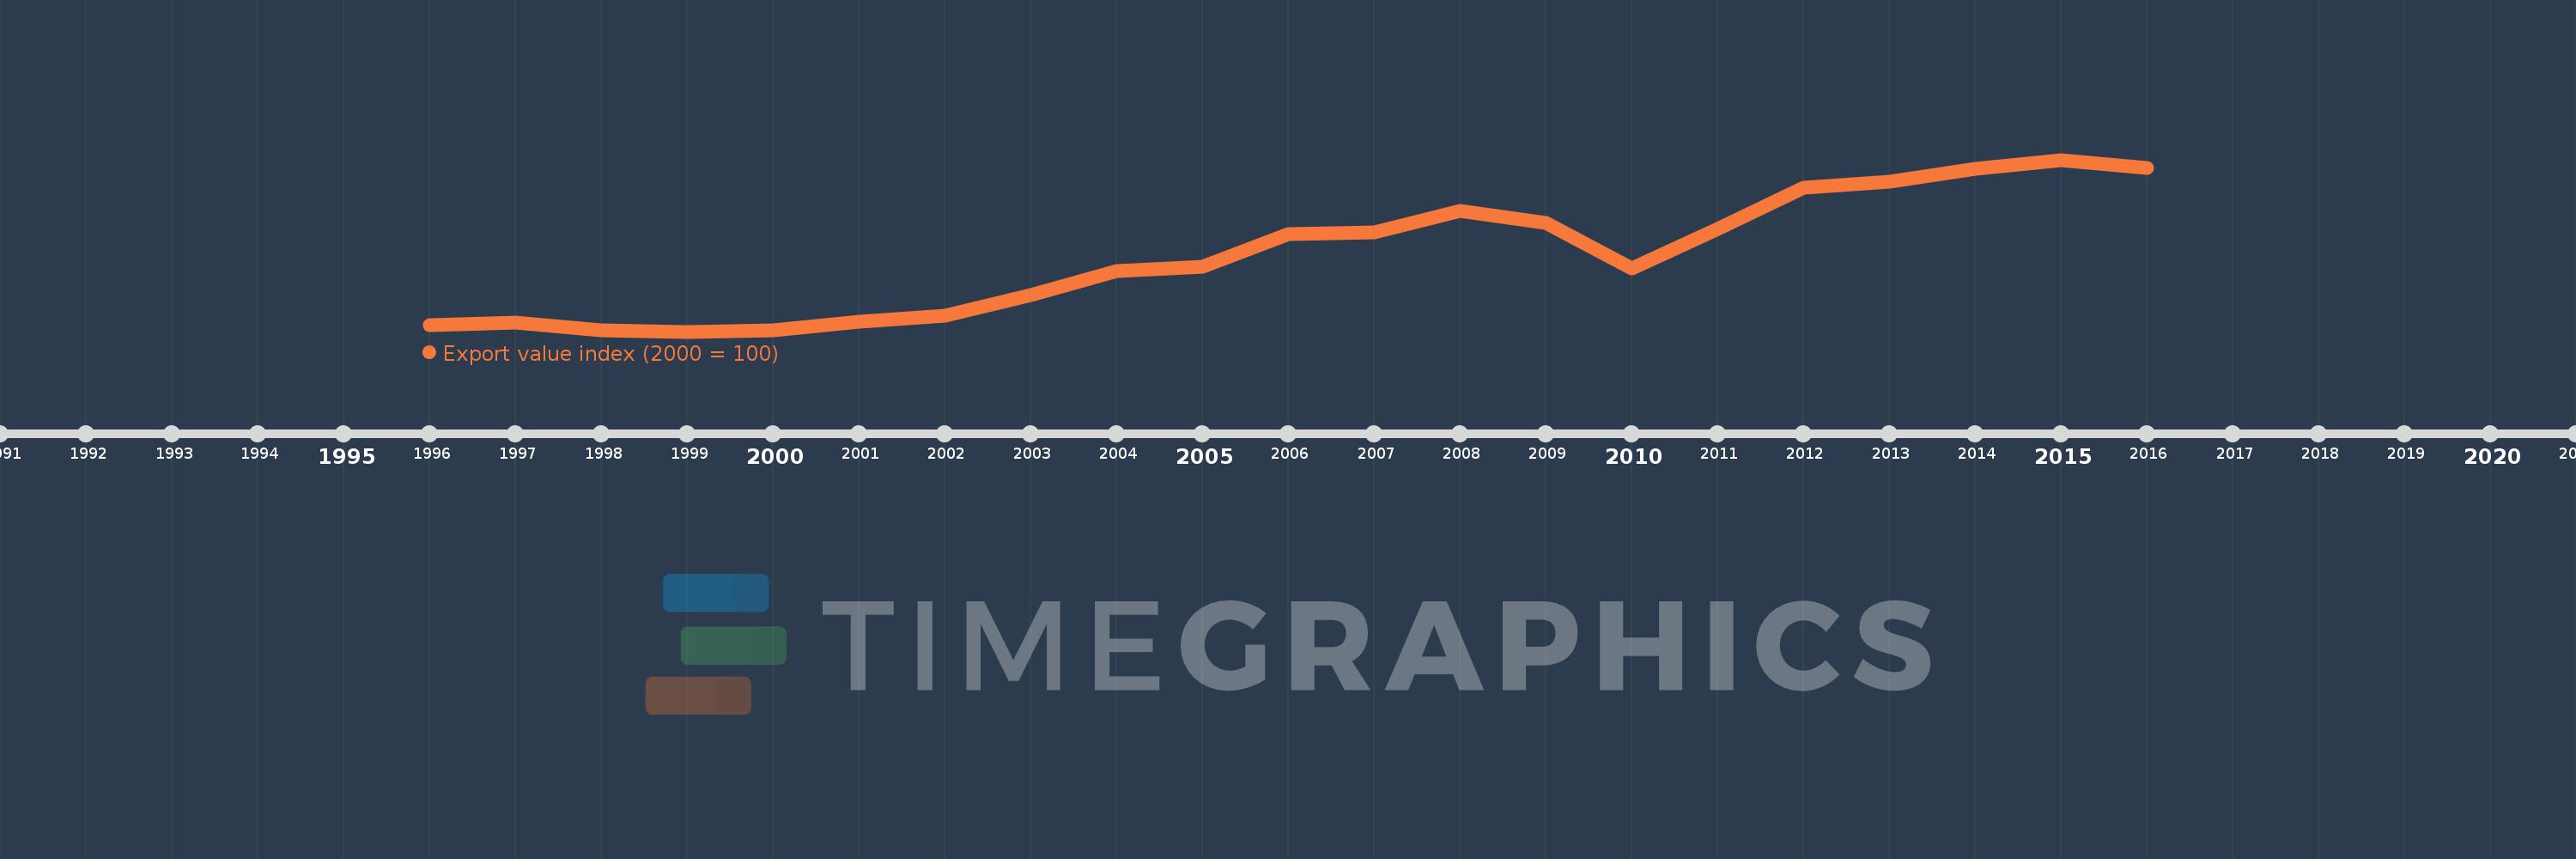
This timeline shows a graph from 1996 to 2016 of Armenia. No data until 1995. Number of actual observations by date: 21.
Source name:
World Development Indicators
Source organization:
United Nations Conference on Trade and Development, Handbook of Statistics and data files, and International Monetary Fund, International Financial Statistics.
Categories, topics:
Private Sector, Trade
Last updated:
apr 23, 2017
Indicators value changes by year
Meaning:
273.783
Minimum:
74.949
jan 1, 1999
Maximum:
525.935
jan 1, 2015
At the date of observation
Value
Absolute change
Change from the previous value
jan 1, 1996
92.08
+92.08
0.0%
jan 1, 1997
98.674
+6.594
7.16%
jan 1, 1998
79.045
-19.63
-19.89%
jan 1, 1999
74.949
-4.096
-5.18%
jan 1, 2000
78.926
+3.977
5.31%
jan 1, 2001
100.0
+21.074
26.7%
jan 1, 2002
116.587
+16.587
16.59%
jan 1, 2003
171.706
+55.119
47.28%
jan 1, 2004
233.039
+61.332
35.72%
jan 1, 2005
245.717
+12.678
5.44%
jan 1, 2006
331.033
+85.316
34.72%
jan 1, 2007
334.84
+3.807
1.15%
jan 1, 2008
391.672
+56.832
16.97%
jan 1, 2009
359.347
-32.325
-8.25%
jan 1, 2010
241.4
-117.947
-32.82%
jan 1, 2011
343.79
+102.39
42.41%
jan 1, 2012
453.535
+109.745
31.92%
jan 1, 2013
469.137
+15.602
3.44%
jan 1, 2014
502.617
+33.481
7.14%
jan 1, 2015
525.935
+23.317
4.64%
jan 1, 2016
505.404
-20.53
-3.9%
Ranking of countries by current statistics by years