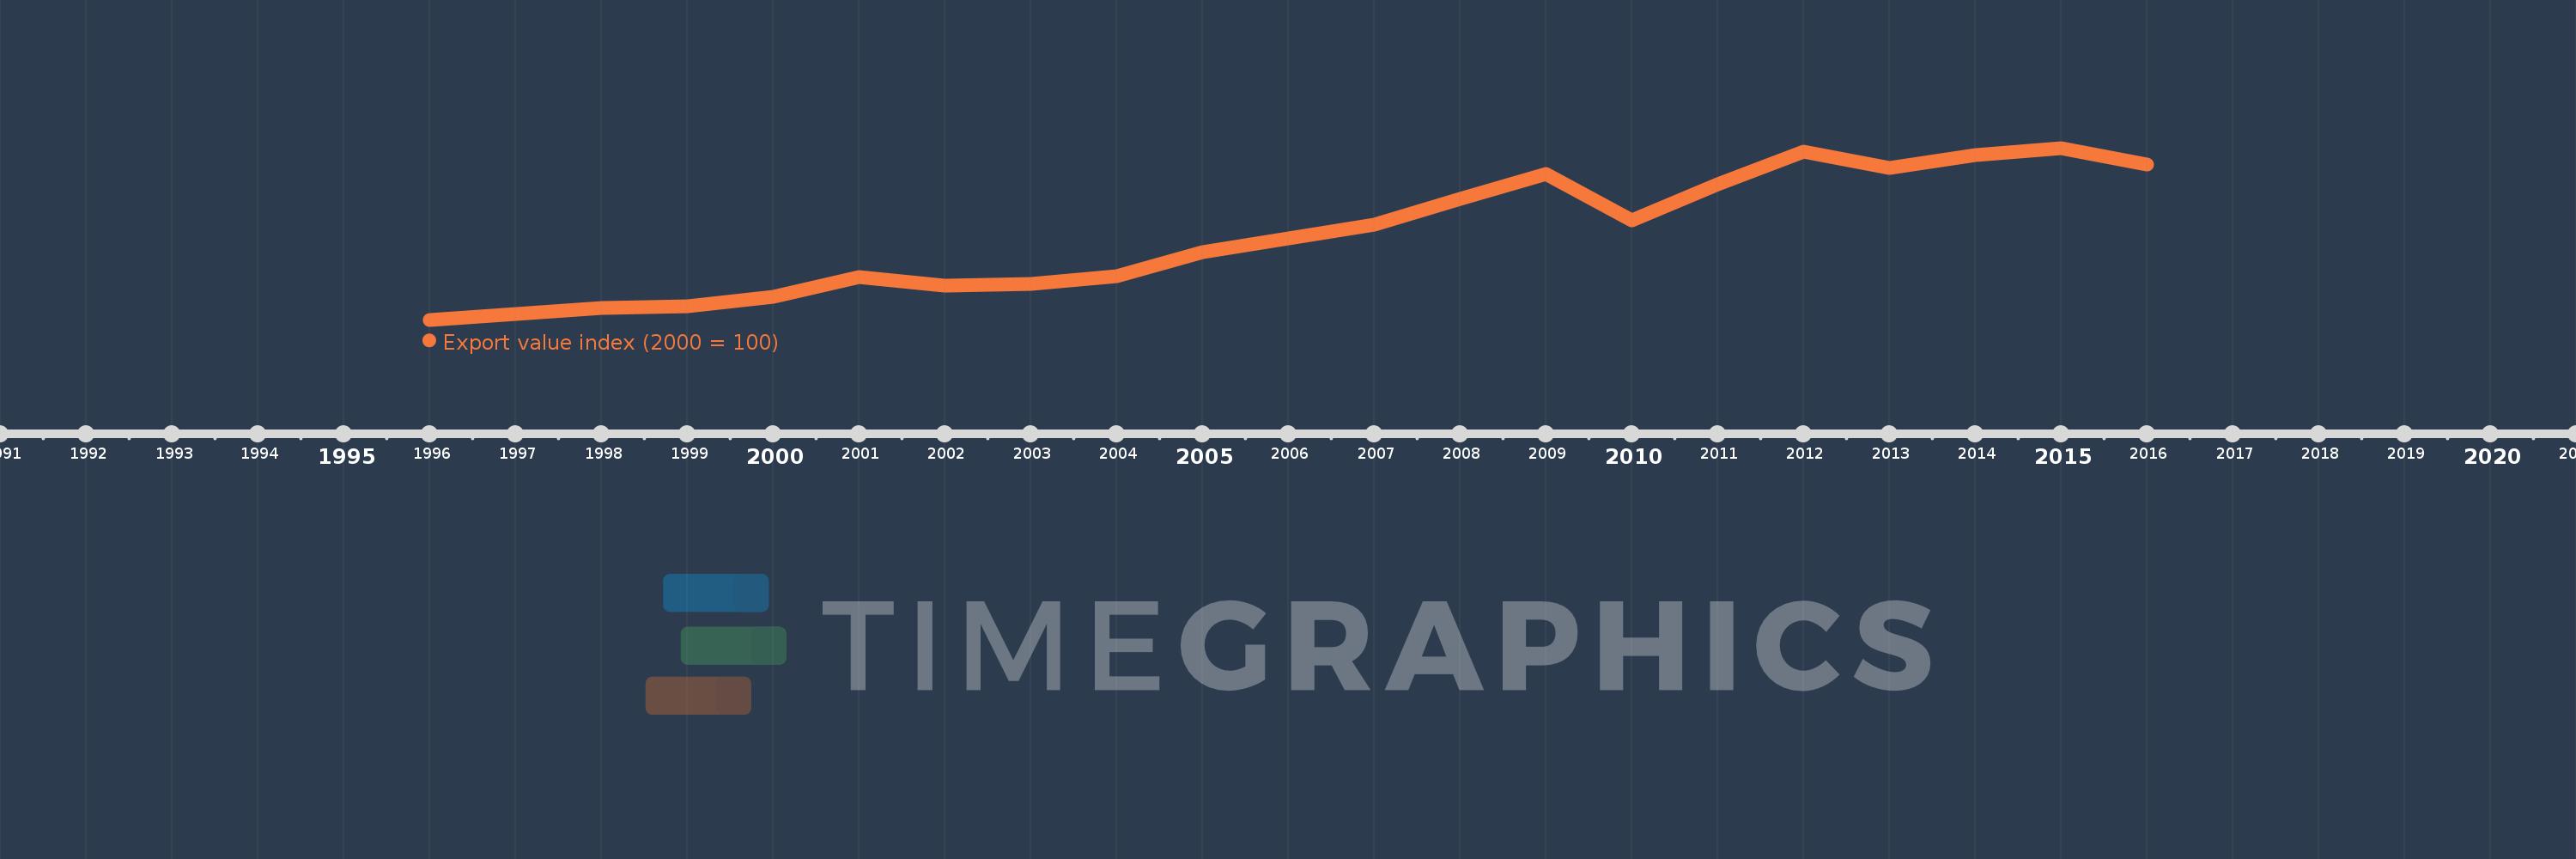
This timeline shows a graph from 1996 to 2016 of Israel. No data until 1995. Number of actual observations by date: 21.
Source name:
World Development Indicators
Source organization:
United Nations Conference on Trade and Development, Handbook of Statistics and data files, and International Monetary Fund, International Financial Statistics.
Categories, topics:
Private Sector, Trade
Last updated:
apr 23, 2017
Indicators value changes by year
Meaning:
138.476
Minimum:
60.648
jan 1, 1996
Maximum:
219.604
jan 1, 2015
At the date of observation
Value
Absolute change
Change from the previous value
jan 1, 1996
60.648
+60.648
0.0%
jan 1, 1997
65.629
+4.981
8.21%
jan 1, 1998
71.654
+6.026
9.18%
jan 1, 1999
73.217
+1.562
2.18%
jan 1, 2000
82.136
+8.92
12.18%
jan 1, 2001
100.0
+17.864
21.75%
jan 1, 2002
92.497
-7.503
-7.5%
jan 1, 2003
93.449
+0.952
1.03%
jan 1, 2004
101.21
+7.761
8.31%
jan 1, 2005
122.972
+21.762
21.5%
jan 1, 2006
136.193
+13.221
10.75%
jan 1, 2007
148.991
+12.798
9.4%
jan 1, 2008
172.243
+23.252
15.61%
jan 1, 2009
195.316
+23.074
13.4%
jan 1, 2010
152.639
-42.677
-21.85%
jan 1, 2011
186.004
+33.365
21.86%
jan 1, 2012
215.883
+29.879
16.06%
jan 1, 2013
201.058
-14.825
-6.87%
jan 1, 2014
212.651
+11.593
5.77%
jan 1, 2015
219.604
+6.954
3.27%
jan 1, 2016
203.993
-15.612
-7.11%
Ranking of countries by current statistics by years